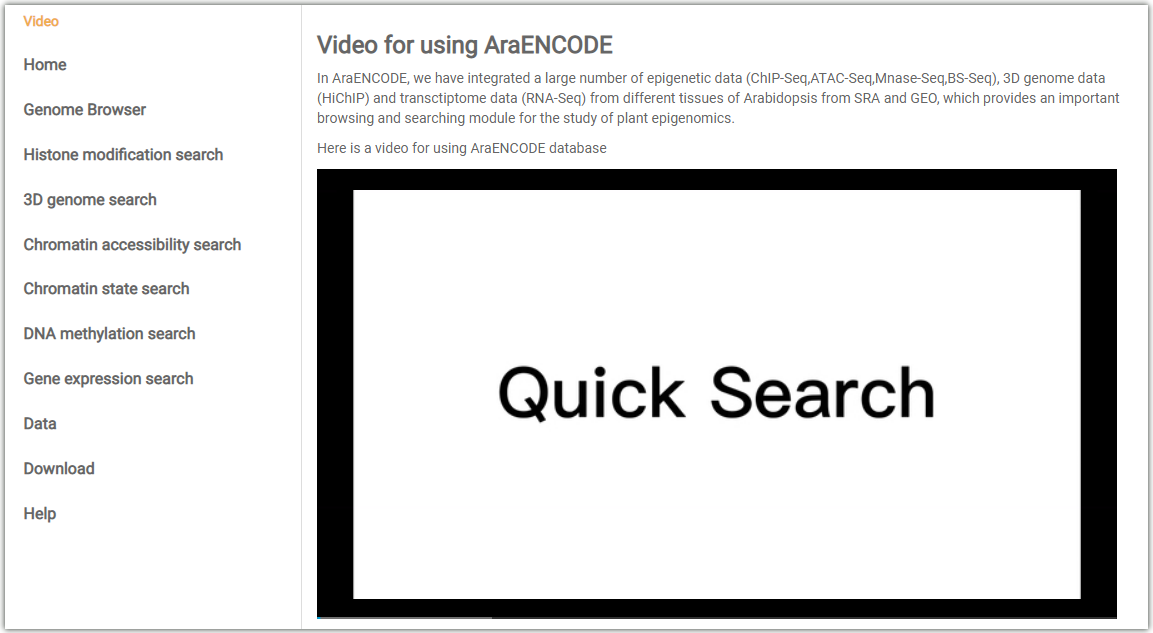
In AraENCODE, we have integrated a large number of epigenetic data (ChIP-Seq,ATAC-Seq,Mnase-Seq,DNase-Seq,FAIRE-Seq,BS-Seq), 3D genome data (Hi-C, HiChIP) and transctiptome data (RNA-Seq) from different tissues of Arabidopsis from SRA and GEO, which provides an important browsing and searching module for the study of plant epigenomics.
Here is a video for using AraENCODE database
The top navigation menu gathers general functions of the database,mainly including Home, Browser, Search, Data, Download and Help modules.
Part 2:Schematic diagram of the introduction to the AraENCODE search module. Each orange part can jump to the page respectively.

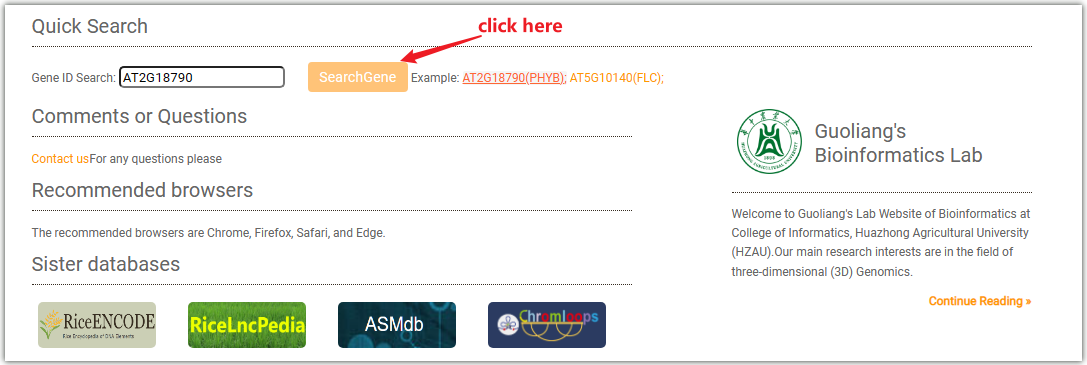
Quick search engine to help users query the histone modification, DNA interaction information, and tissue expression flexibly. This kind of global search can help users quickly locate the marker histone modification or DNA interaction, especially when users have no clear target histone modifications to search. Select target genome and tissues then submit the gene ID and click on the search button.
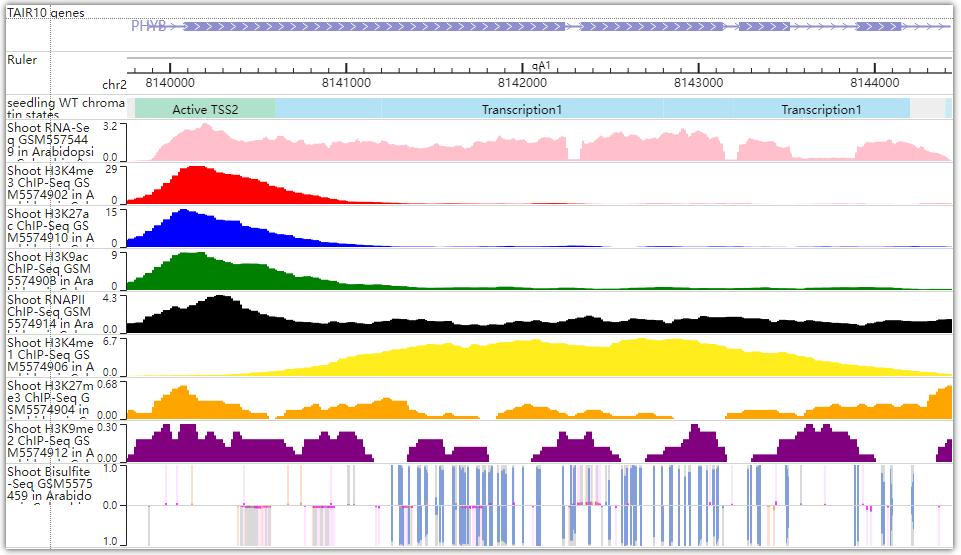
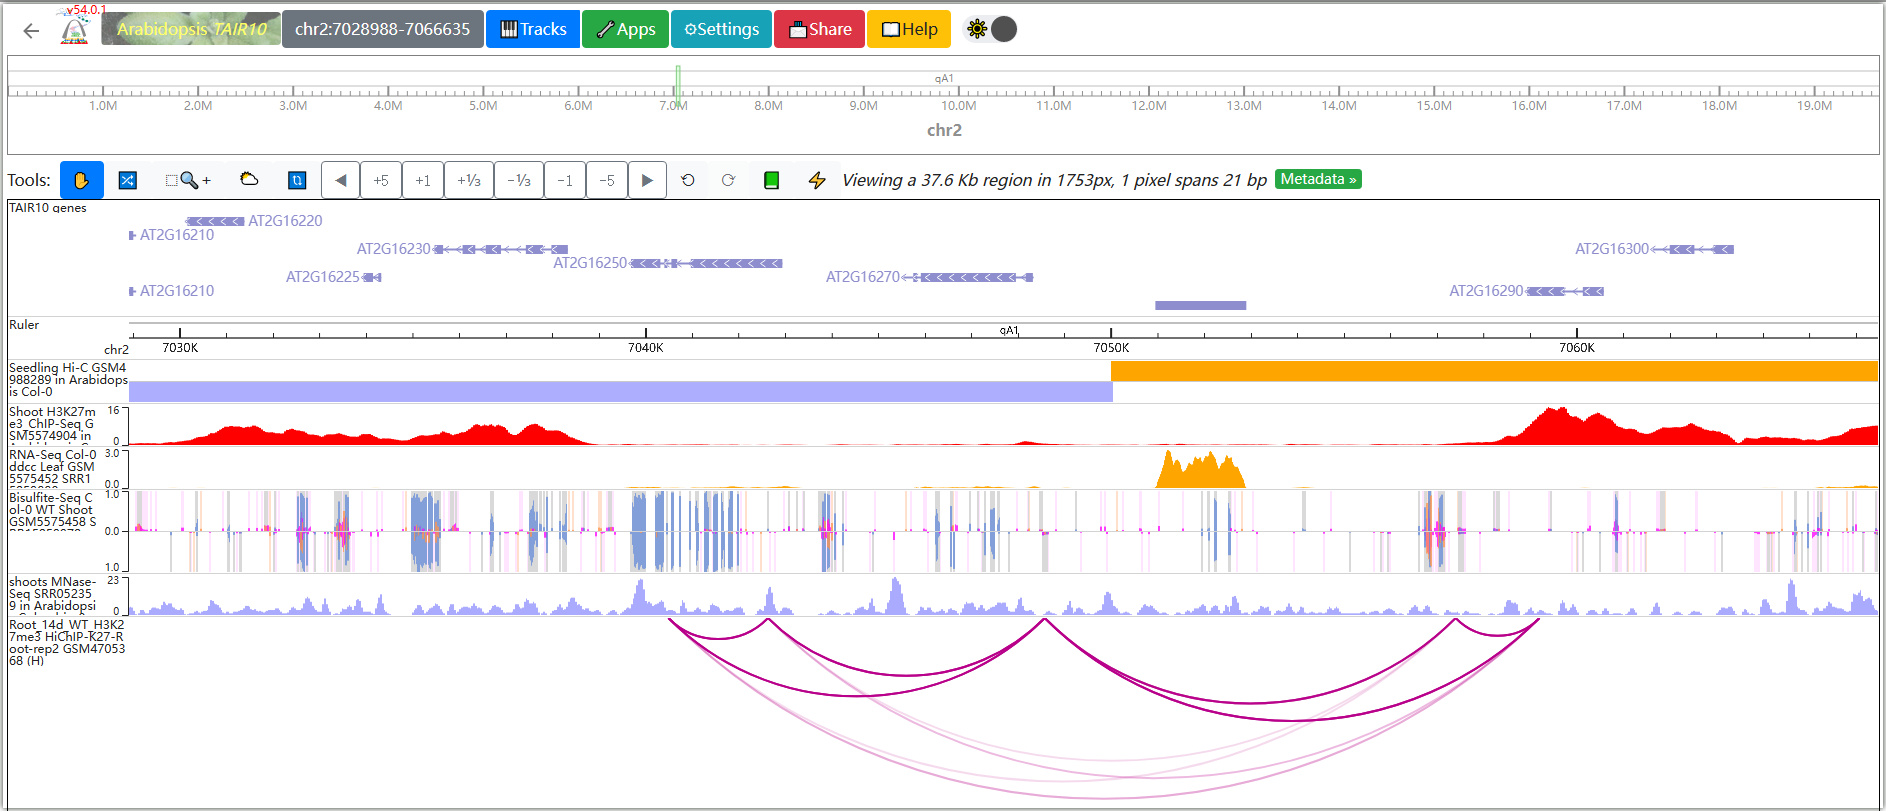
For example (PHYB) the genome browser in results like this:
The PHYB gene position will be located in the WashU browser. You can add the orbit you need in the browser to view various histone modifications, LSD/CSD domain distribution, chromatin accessibility, chromatin state, gene expression and so on.
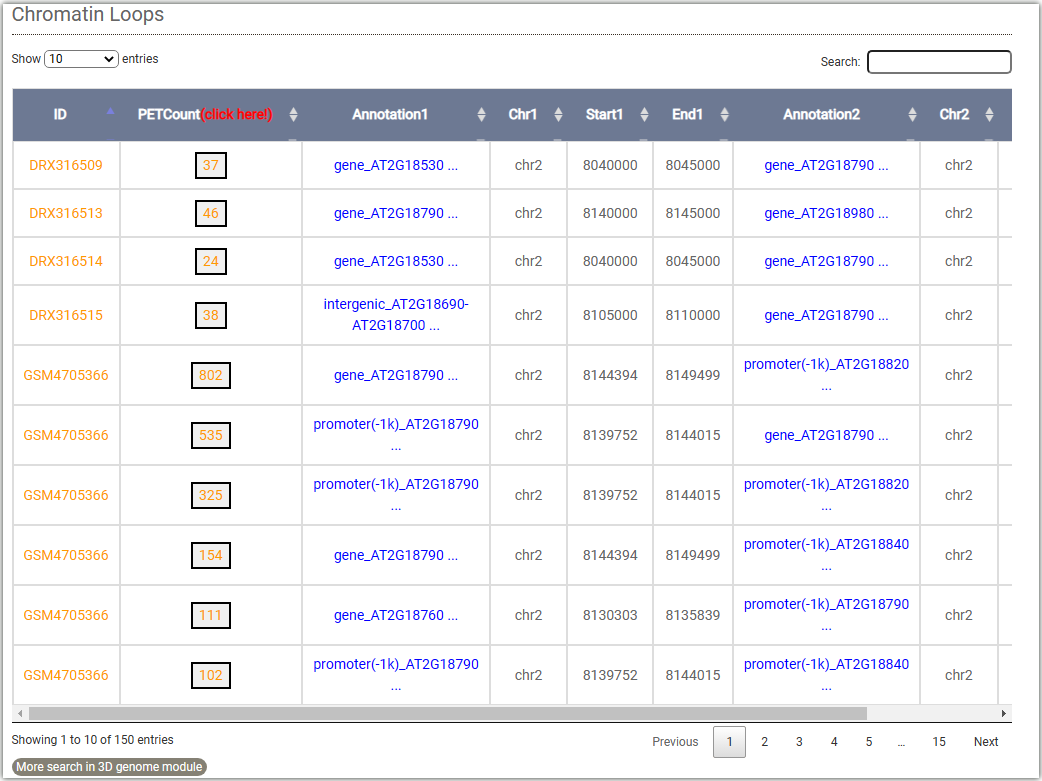
The resulted tabular layout looks like this:
In Browser module, AraENCODE provides a WashU Epigenome Browser instance to better visualize large number of epigenetic datasets.More details about WashU Epigenome Browser can be found in its official documentation: WashU Epigenome Browser Documentation
Click on ①, and a pop-up window will appear where you can enter the gene ID, SNP ID, and chromosome region you are interested in.


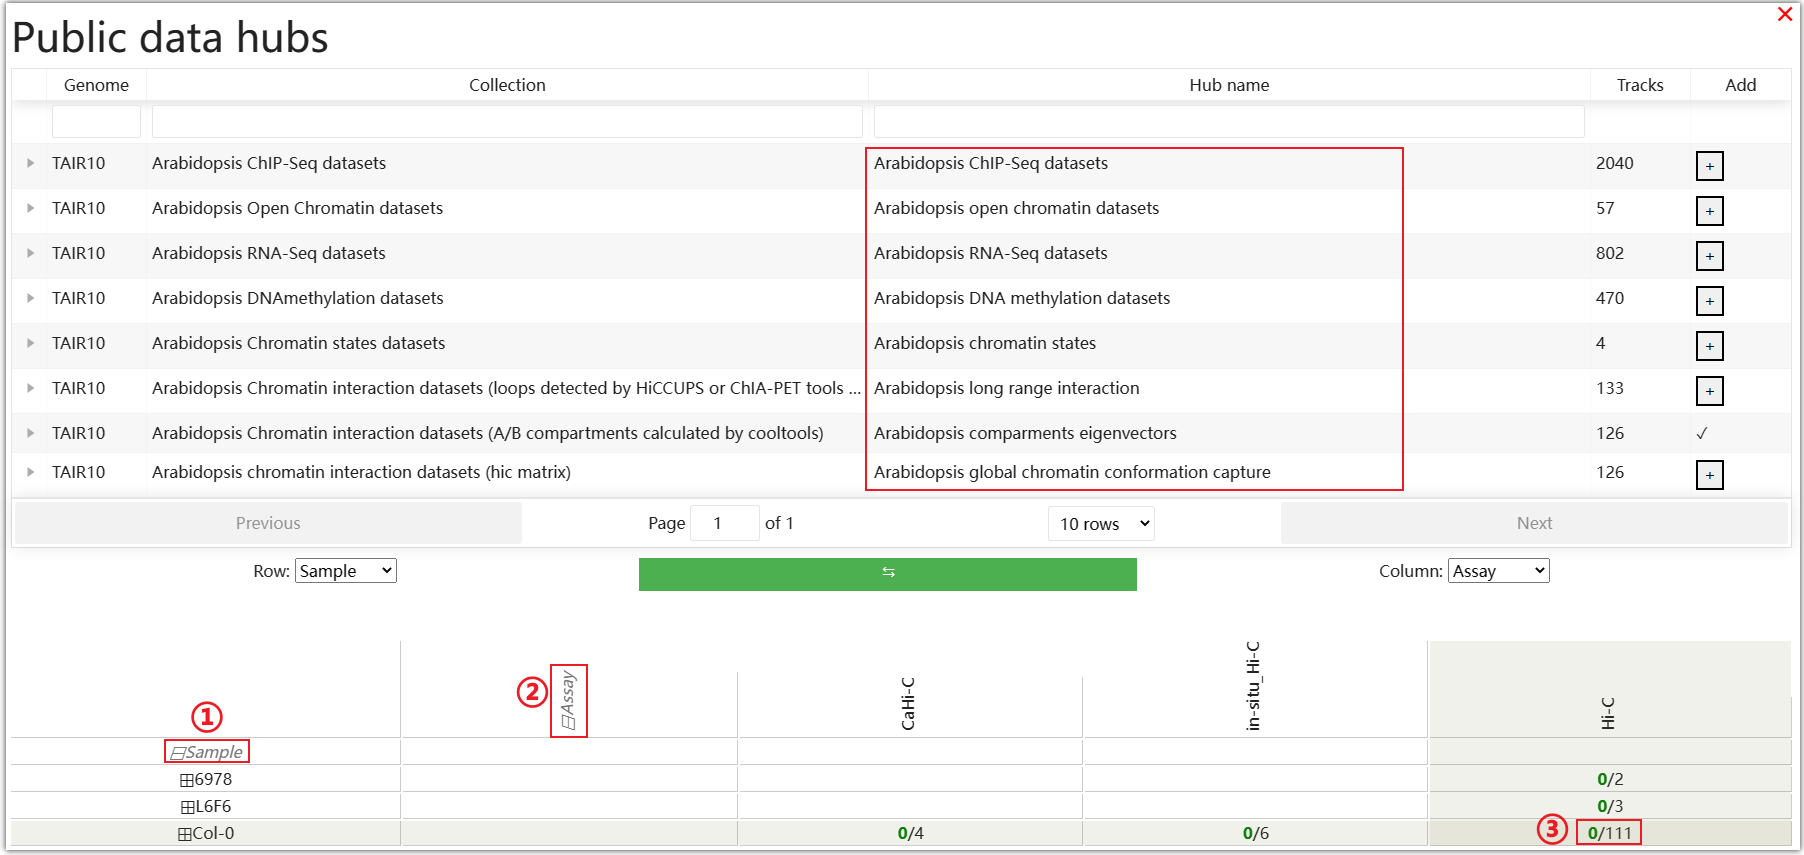
In the Public data hubs, AraENCODE has collected various epigenetic and 3D data of Arabidopsis. You can select the desired data type and click the "+" symbol on the right. For example, select the "Arabidopsis compartments eigenvectors" data type, then click ① and ② to make a selection in the matrix based on the ecotype of Arabidopsis and the Hi-C experimental method. Click ③ as an example.

You can freely modify the display format and color of tracks in the WashU browser.
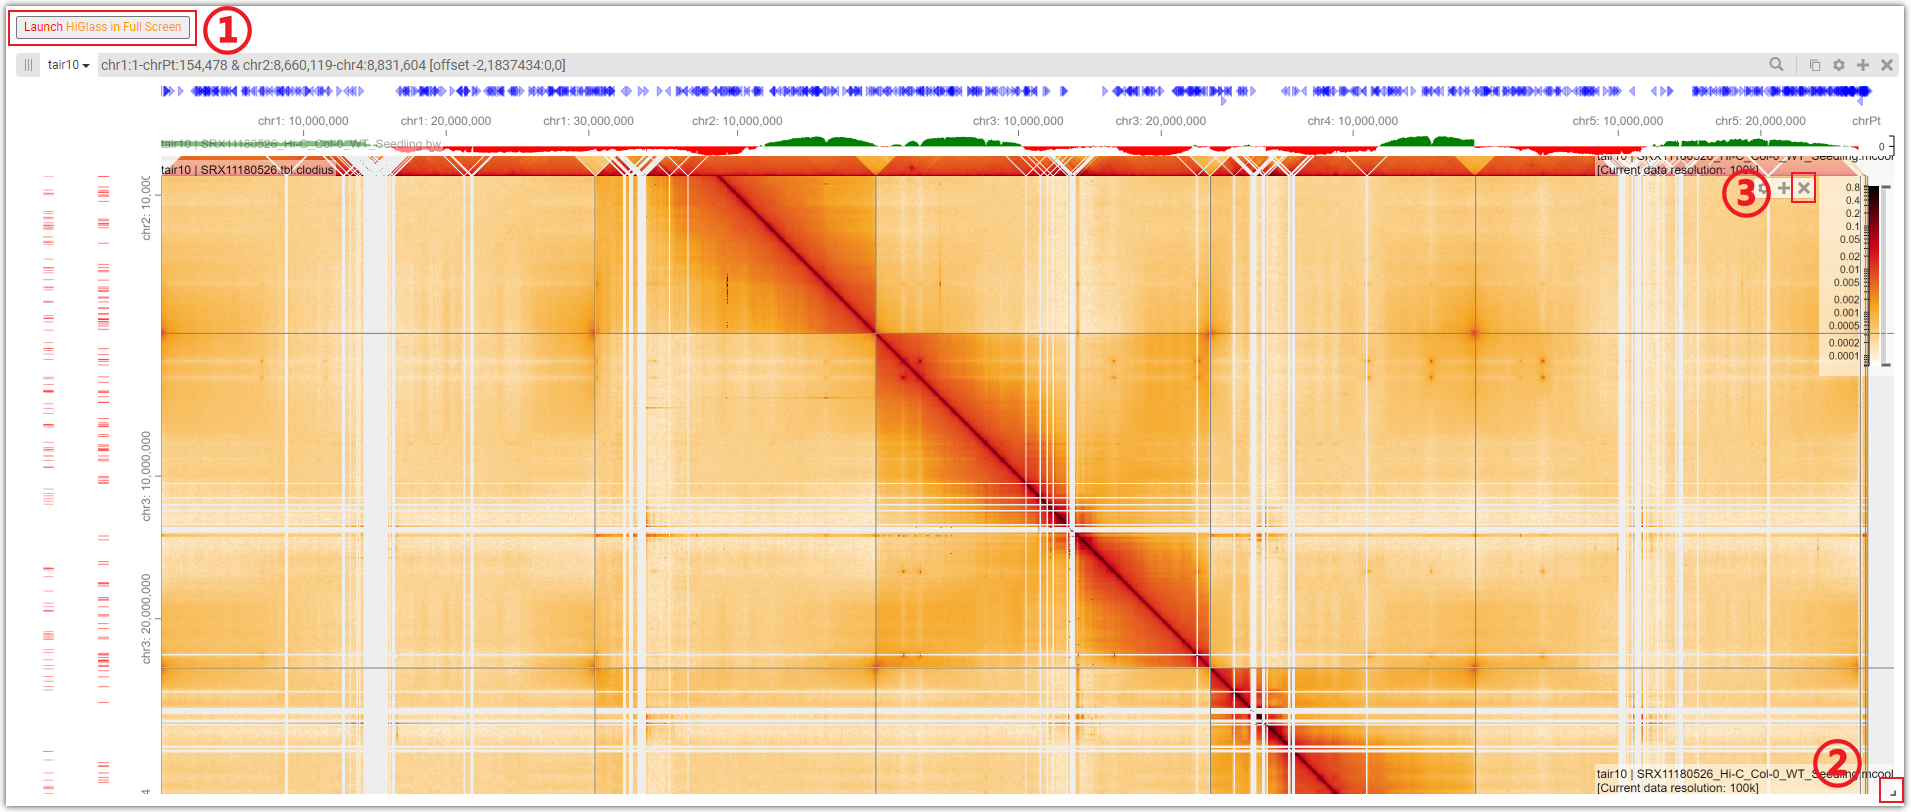
In Browser module, AraENCODE provides a HiGlass Multi-Scale Browser instance to better visualize 3D genome datasets.More details about Higlass Browser can be found in its official documentation: Higlass Browser Documentation
Click on ① to use the HiGlass browser in full screen mode. Dragging ② allows you to resize the HiGlass browser window. The HiGlass browser in AraENCODE automatically imports some data by default. If you don't want them, you can click on ③ to remove these tracks.
Click the "+" symbol and select the desired tracks to add them in the top, center, bottom, left, or right positions.

You can select the desired data in region ① and choose the display format of the track in region ②.

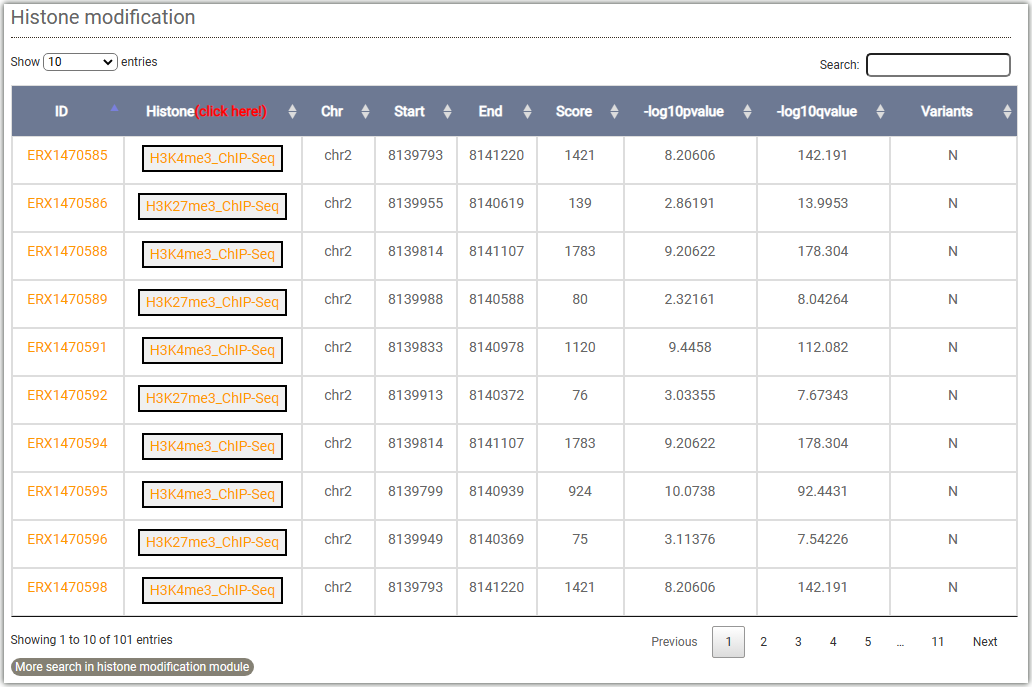
To get the histone modification signals information, you can either select a target gene(①) or a genome region(②) after you selected tissues and histone mark.And click on the Search button to get the results.

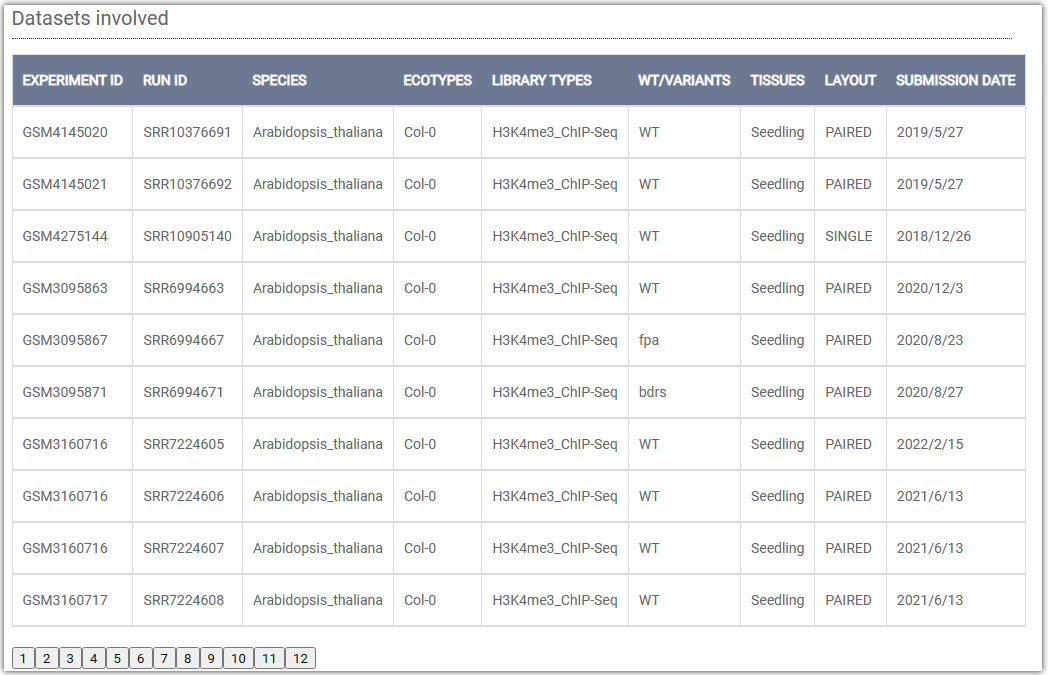
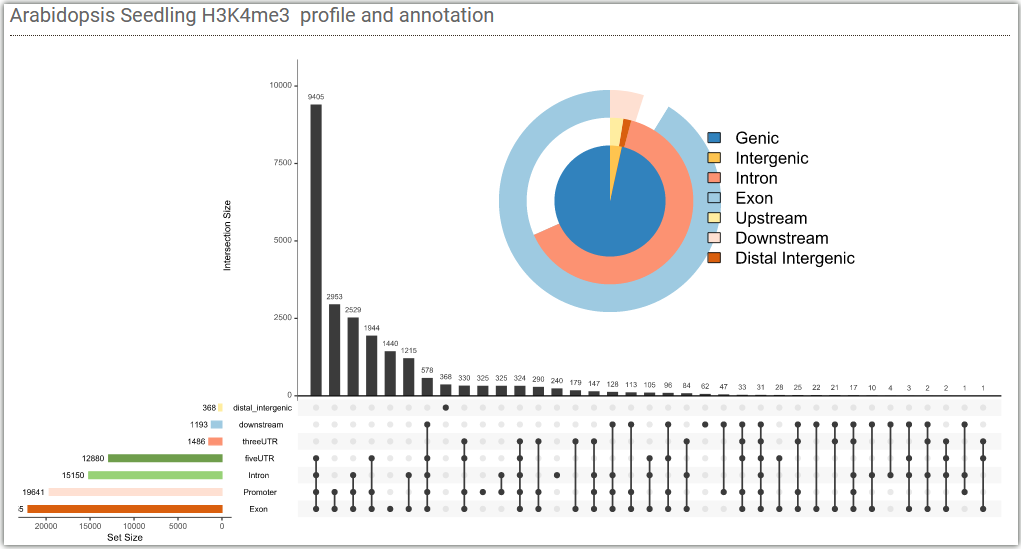
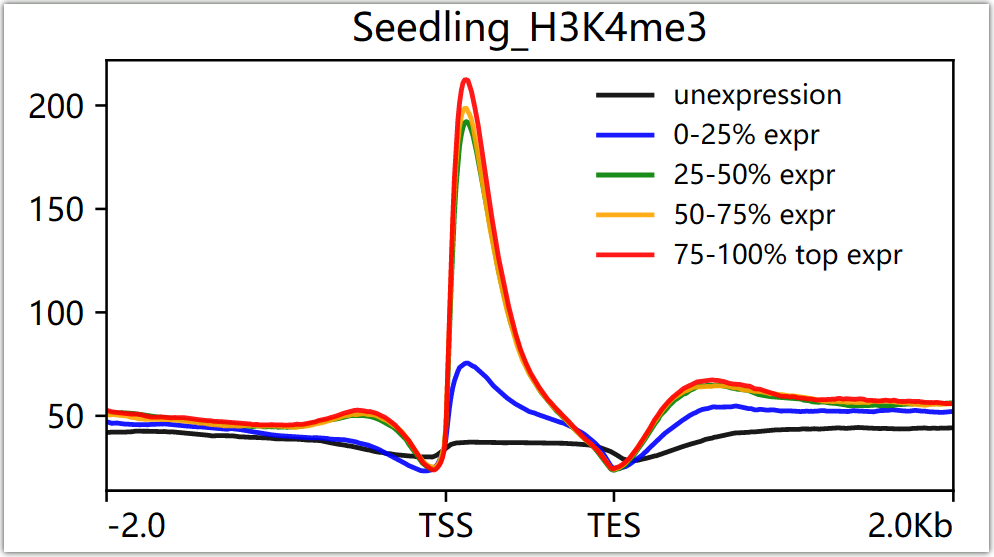
Datasets involved: This displays the ChIP-seq results of H3K4me3 in all seedling tissues of Arabidopsis in AraENCODE.
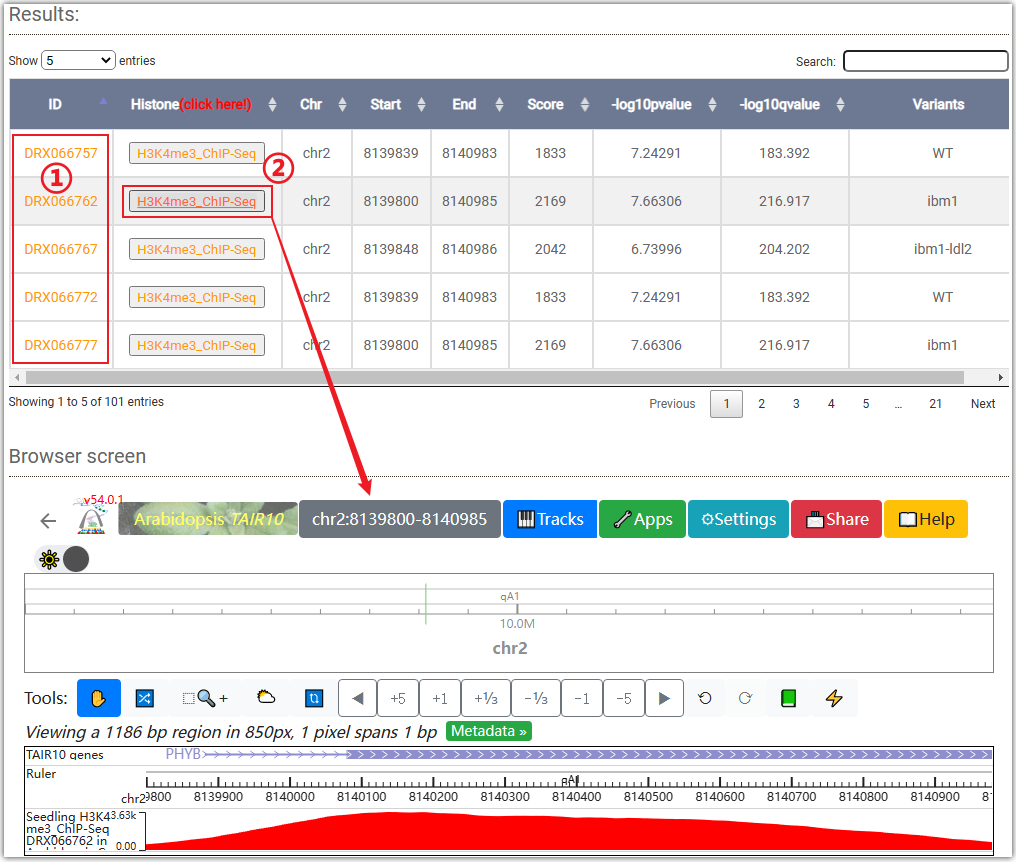
Results: Displays the ChIP-seq signal of histone modification H3K4me3 on
the gene body or chromosome region you have entered.
Clicking on the ID column (①) will automatically redirect you to the SRA or GEO
database.
Clicking on ② will open a "Browser screen" window under the table, and the data will
be automatically imported into the WashU browser.
Below are two figures showing the enrichment of H3K4me3 signals in different gene elements and the distribution of signals at the upstream and downstream 2kb of gene body with different expression levels in Arabidopsis seedling tissues.
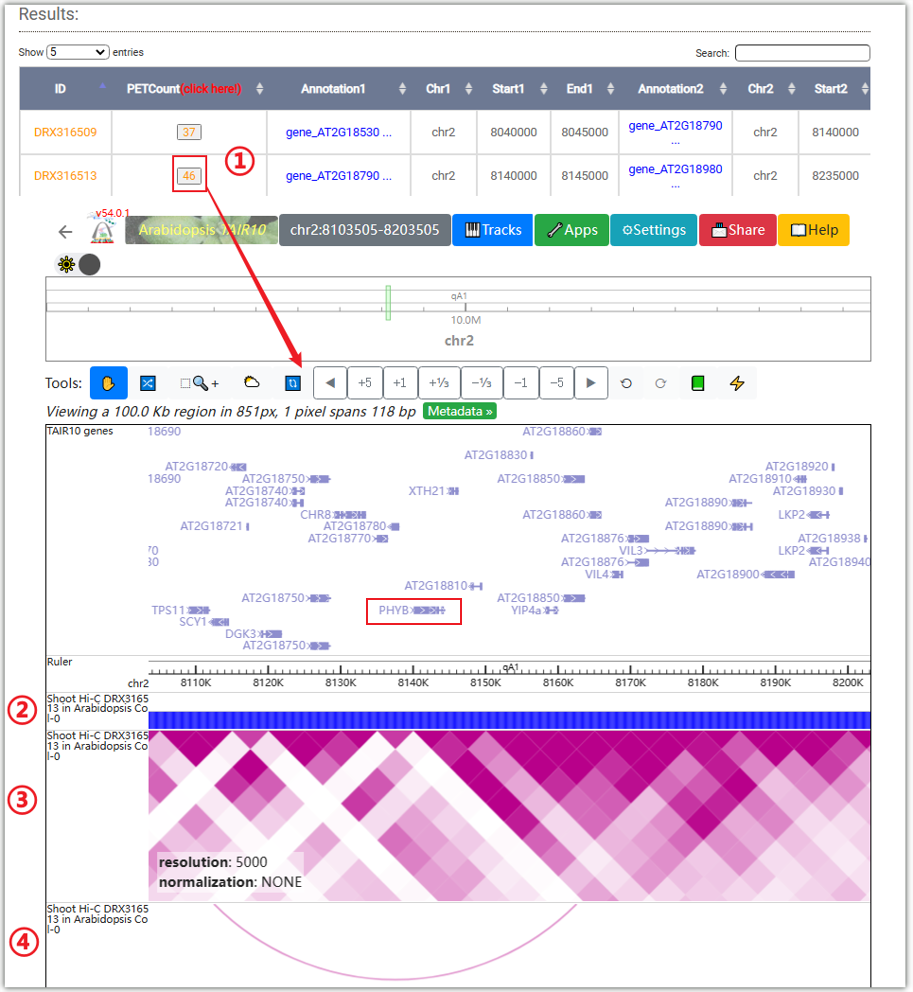
To get the 3D interactions information, you can either select a target gene(①) or a genome region(②) after you selected tissues.Then click on the Search button to get the results.And you can filter the results based on "PET count".

The resulted tabular layout looks like this.
Clicking on ② will open a "Browser screen" window under the table, and the data will
be automatically imported into the WashU browser.
②, ③, and ④ are the tracks representing compartment, Hi-C interaction heatmap, and
chromatin loops for the data.
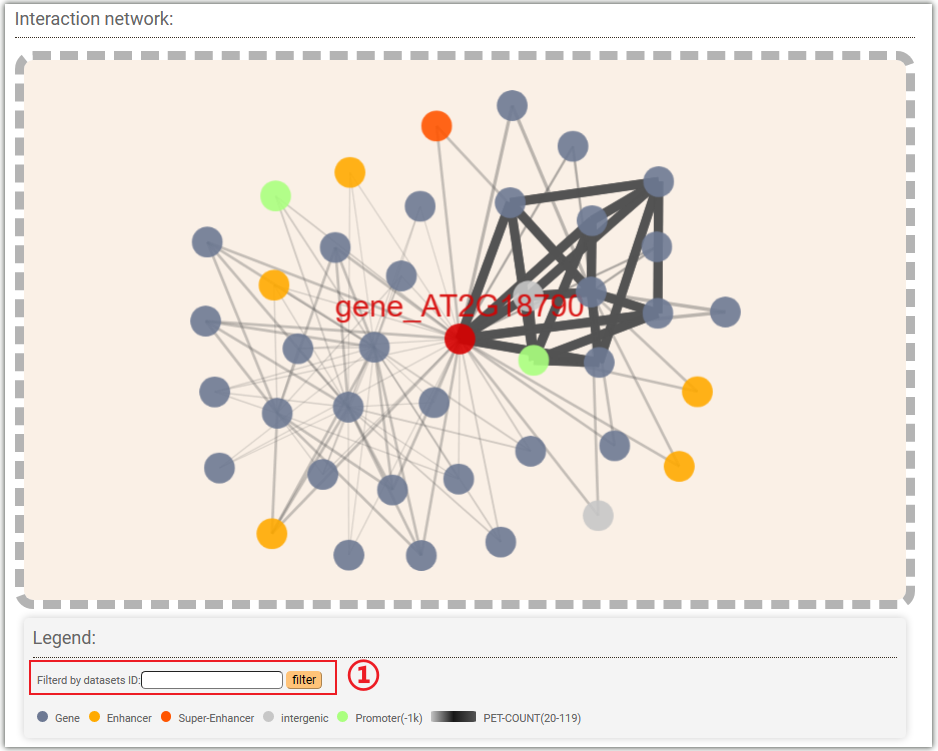
In the "Interaction network" module, AraENCODE displays the interaction network between the selected genes and various gene elements. You can also filter the results by datasets ID by entering the corresponding ID in the input box marked as①.
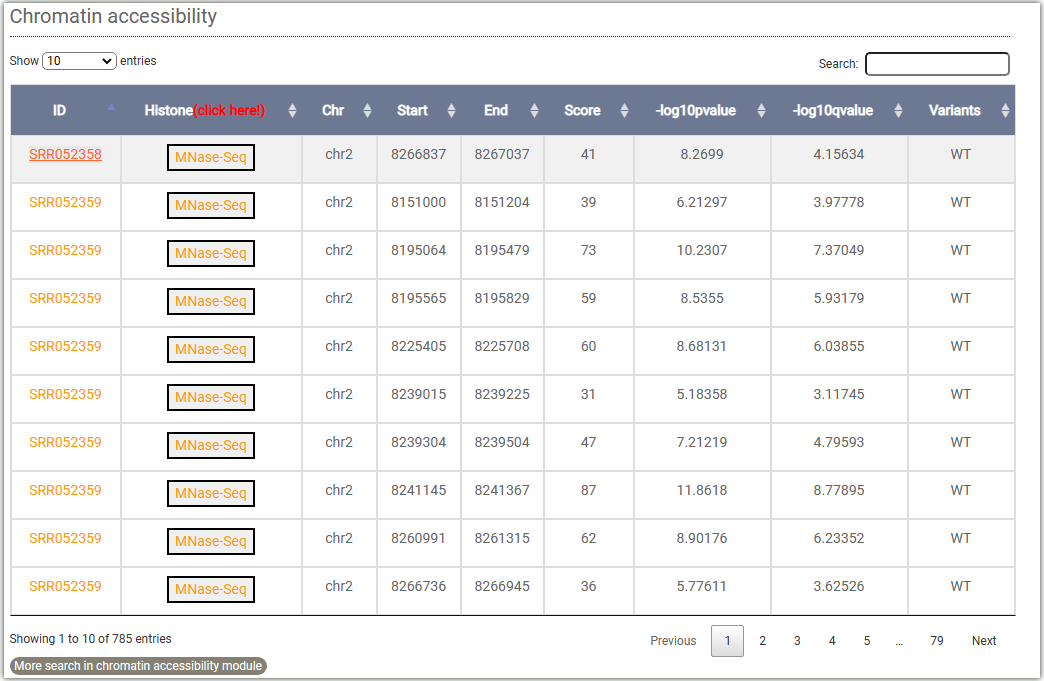
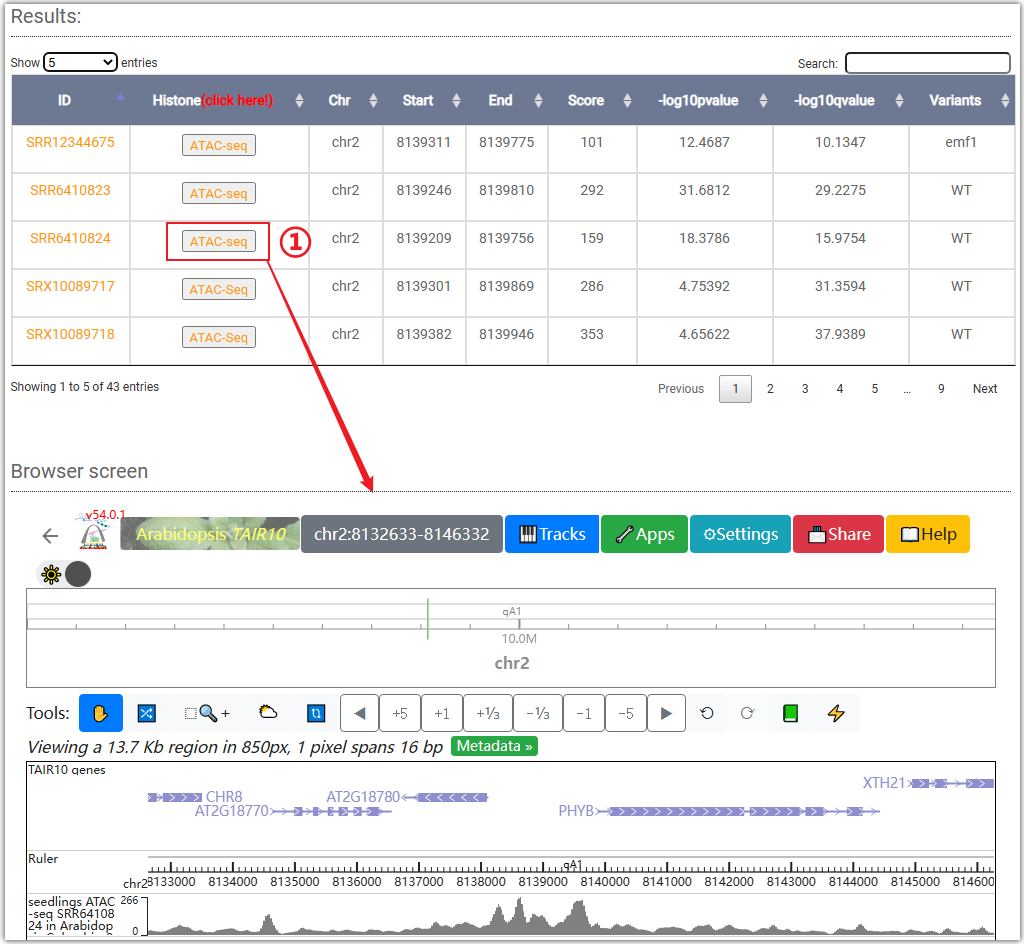
To get the chromatin accessibility information, you can either select a target gene(①,and you can choose to query either the gene body or the TSS (Transcription Start Site) attachment) or a genome region(②) after you selected tissues and chromatin accessibility signals (Dnase-Seq,ATAC-Seq,Mnase-Seq,FAIRE-Seq). And click on the Search button to get the results.

Clicking on ② will open a "Browser screen" window under the table, and the ATAC-seq data will be automatically imported into the WashU browser.
AraENCODE provides chromatin states search module. Although users are only allowed to search limited vairants we collected, the easily online search module can help biologists better understand the epigenetic regulation of interested regions or genes.

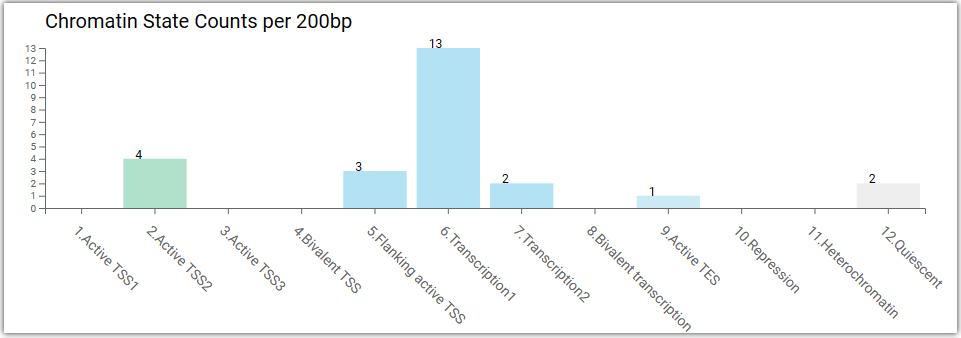
Chromatin states per 200 bp:
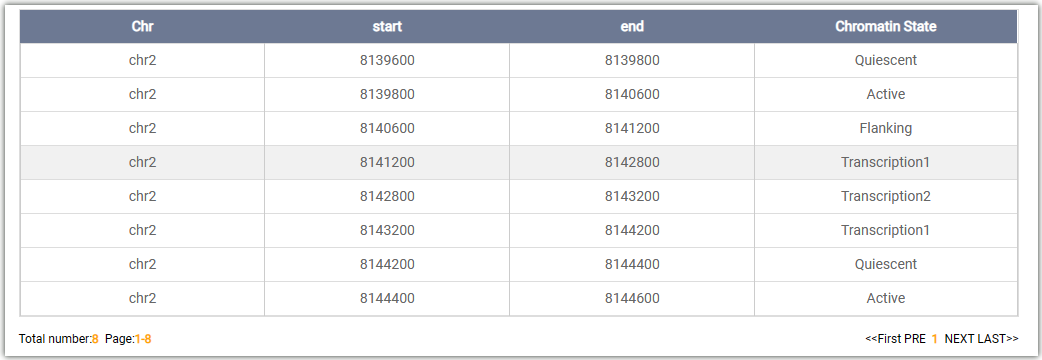
Genome wide chromatin states:

Chromatin states on search regions:
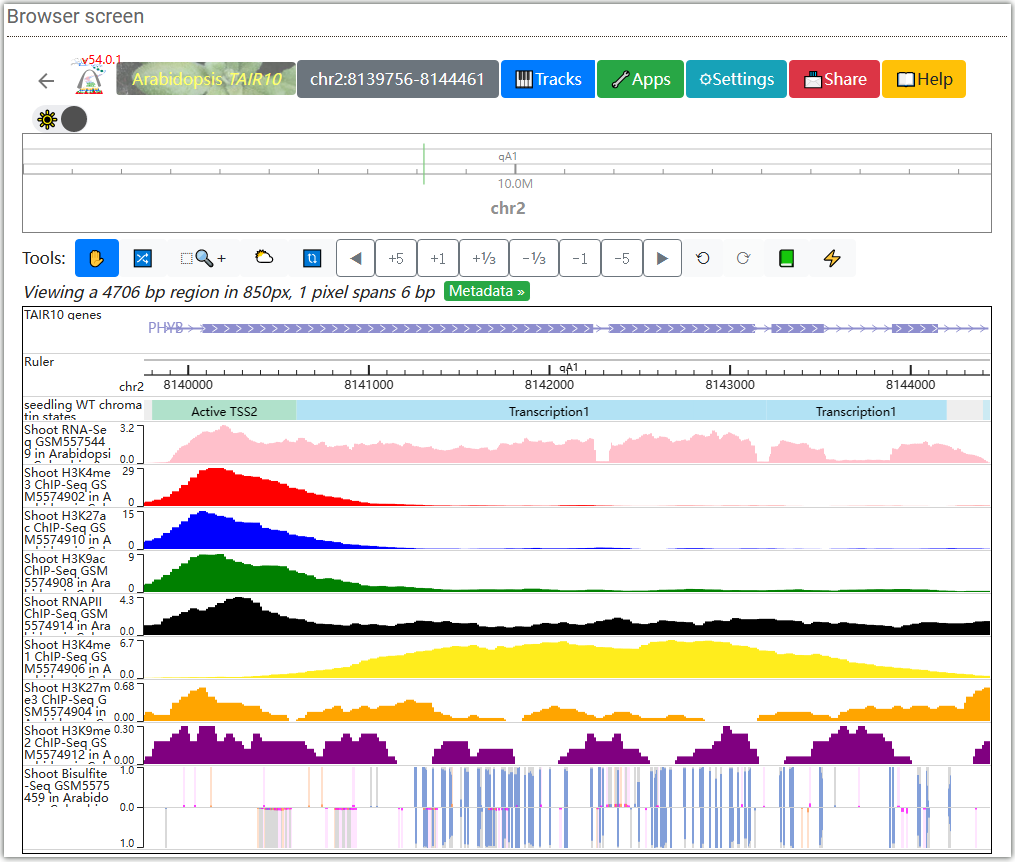
Epigenome landscapes:
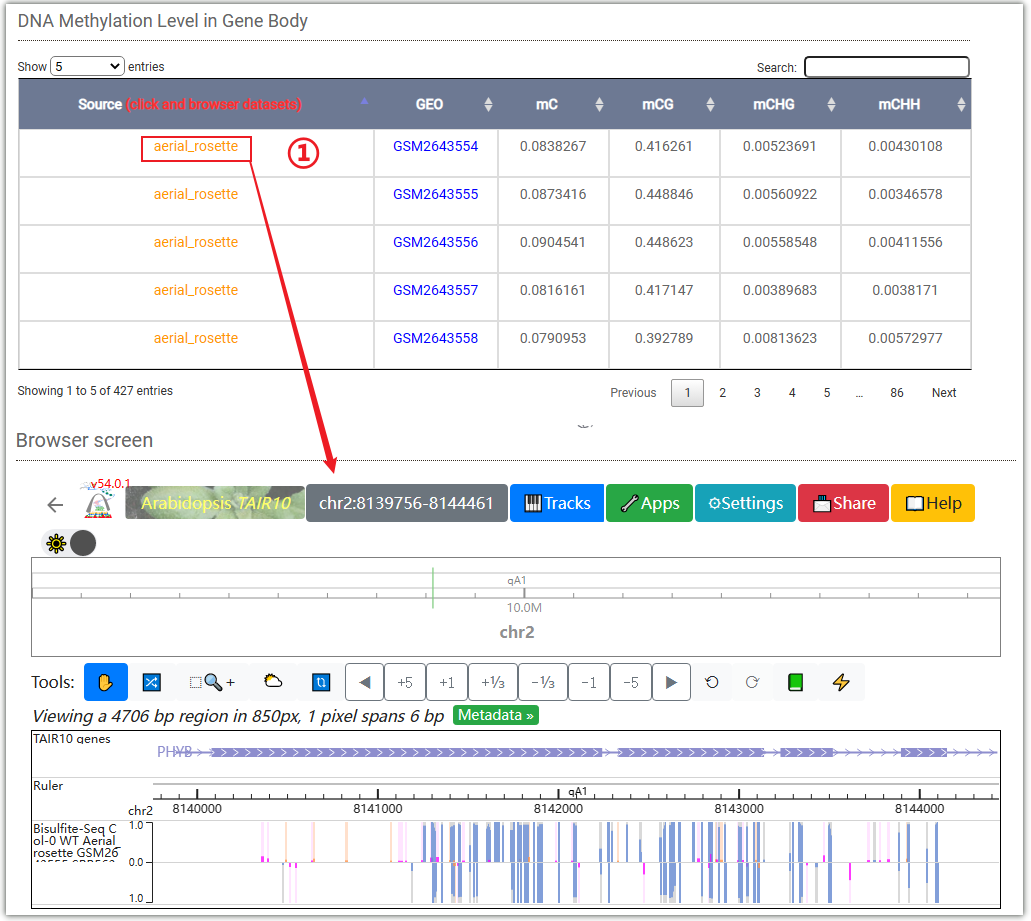
In DNA methylation search module, users can easily search DNA methylation level for genes ,regions between different tissues.

This table displays the methylation level on the PHYB gene body. Clicking on ① will automatically display the data in the WashU browser.
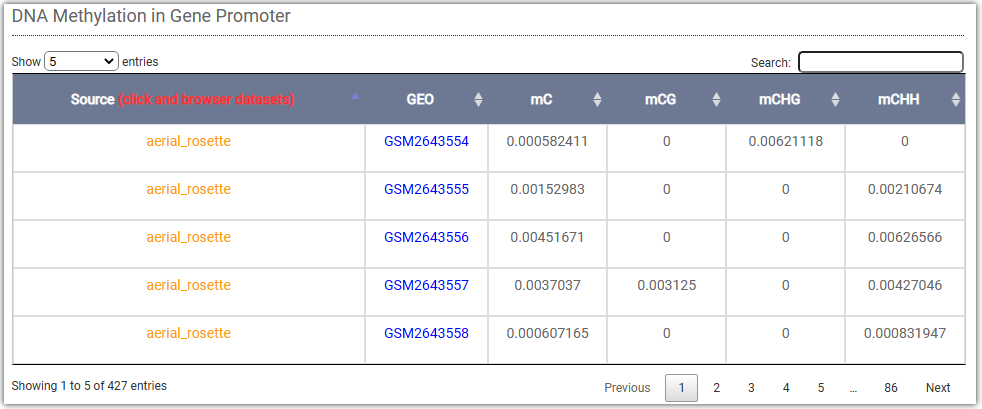
This table displays the methylation level on the PHYB gene promoter:
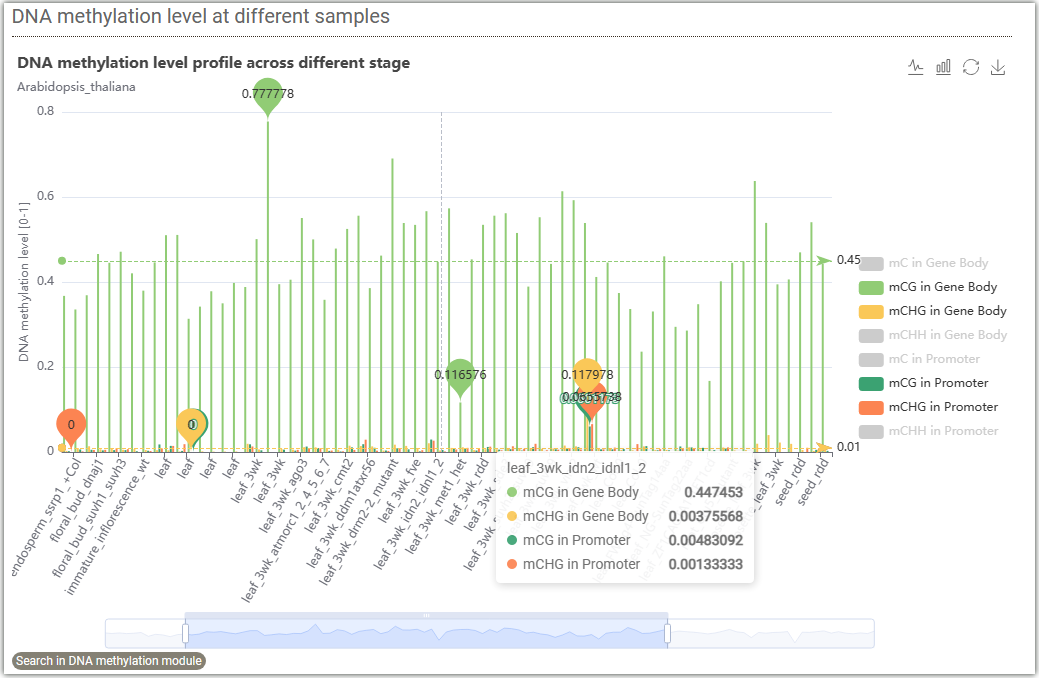
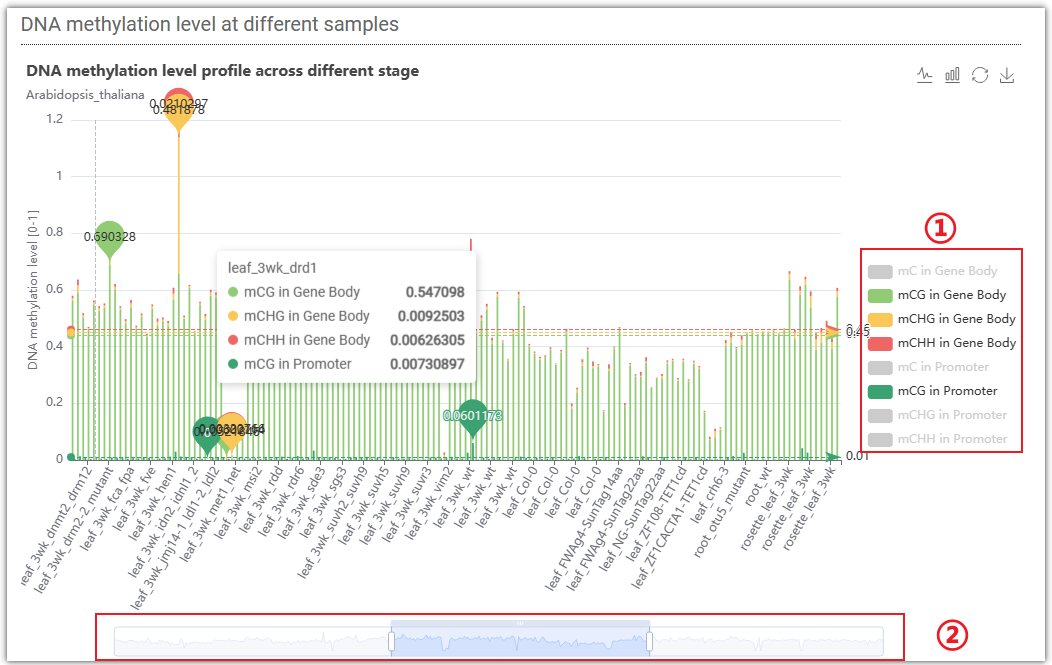
This figure displays the DNA methylation levels at different samples. By clicking on ①, you can select different methylation levels on gene body or promoter. Grey color represents unselected, while colored ones represent selected. You can drag the progress bar ② to choose different samples.
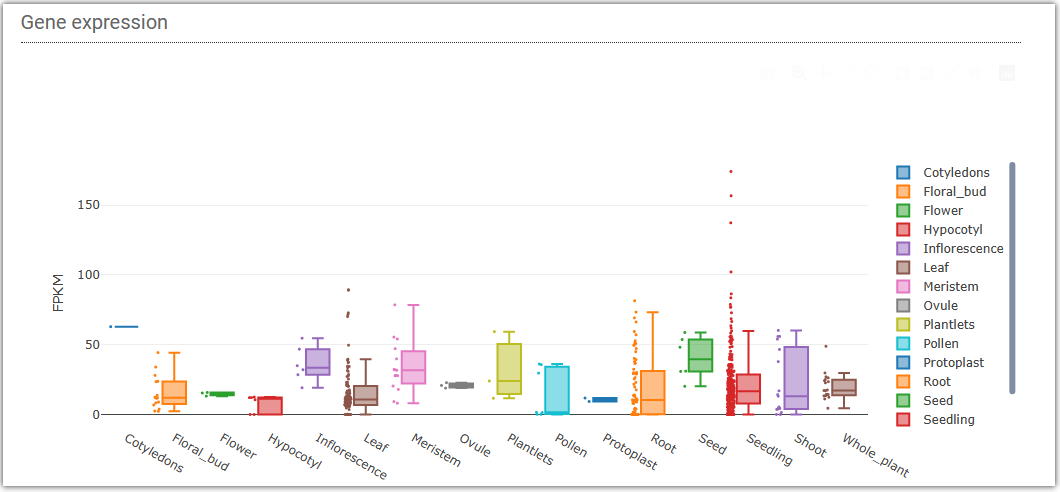
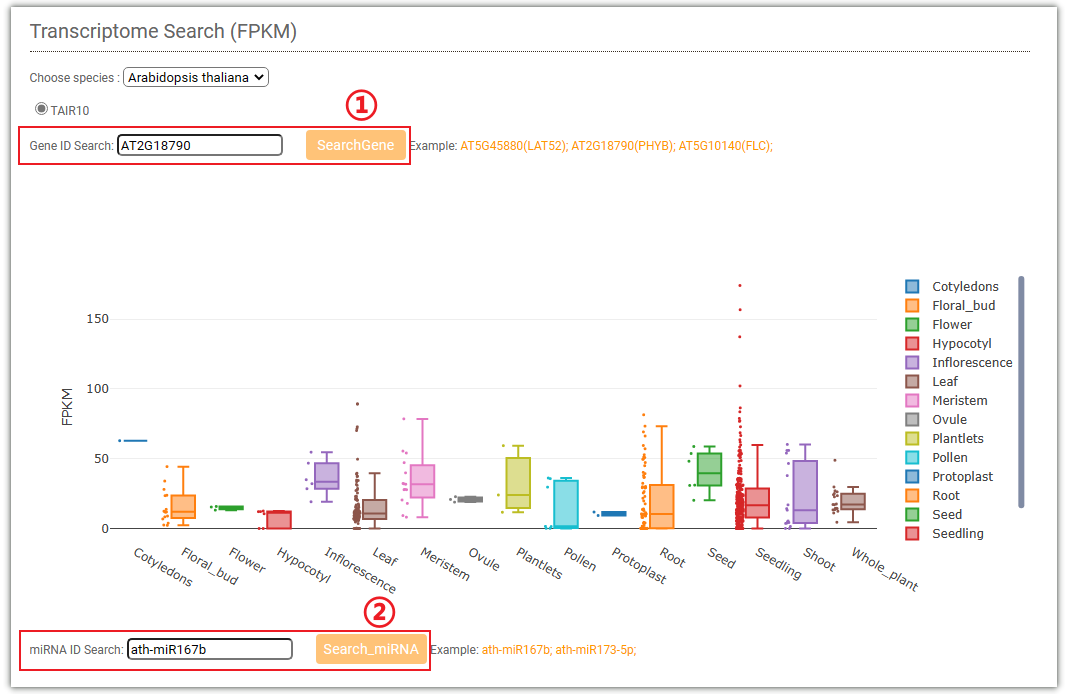
In gene expression search module, you can easily search for FPKM from different tissues
transcriptome data(RNA-Seq) we collected.
You can select to input gene ID (①) or miRNA ID (②) to query the expression levels
of the gene
or miRNA, and the results will be displayed in the form of box plots.
This table displays all the data collected by AraENCODE for Arabidopsis thaliana:

The distribution of data collected by AraENCODE in different years is presented in two forms, a Venn diagram(①) and a line chart(②). To view the distribution, simply move the mouse over the different years on the line chart, and the Venn diagram will change accordingly.

The following bubble chart displays the distribution of data for wild type and mutant type in different tissues of Arabidopsis collected by AraENCODE. The size of each bubble represents the amount of data.

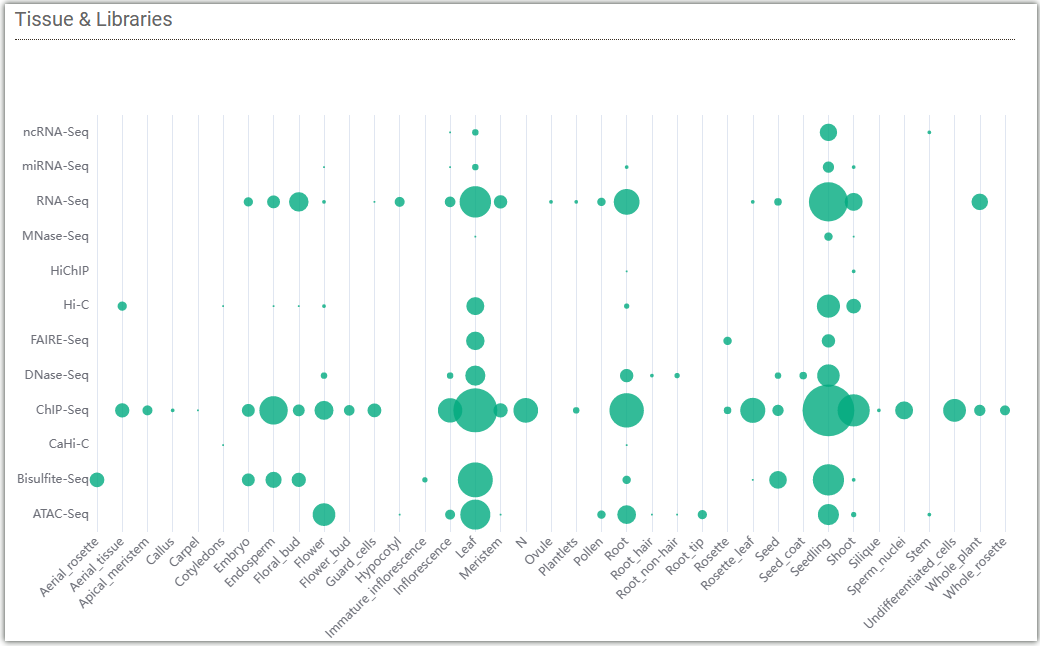
The following bubble chart displays the distribution of data from libraries in different tissues of Arabidopsis collected by AraENCODE. The size of each bubble represents the amount of data.
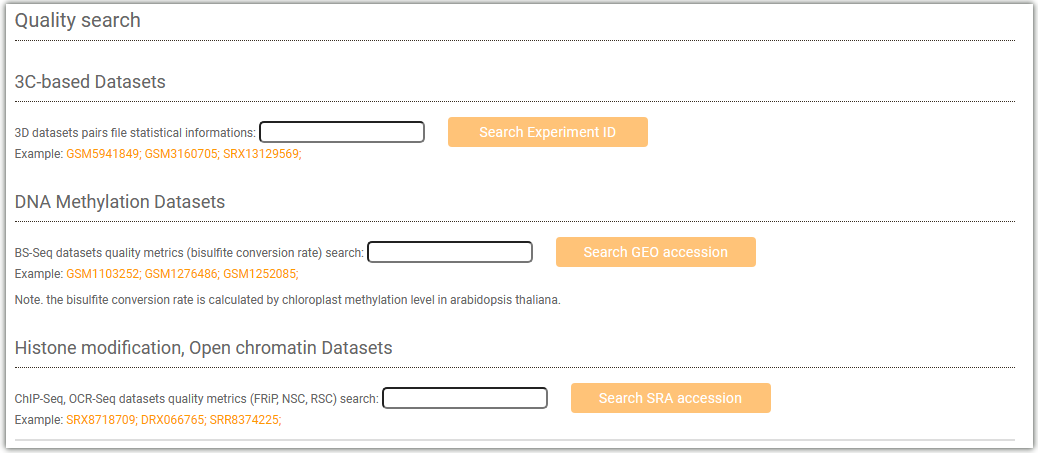
AraENCODE provides a "Quality Control" module, which allows you to select different libraries (3C-based Datasets, DNA Methylation Datasets, Histone modification, Open chromatin Datasets) to query the quality of the corresponding data.
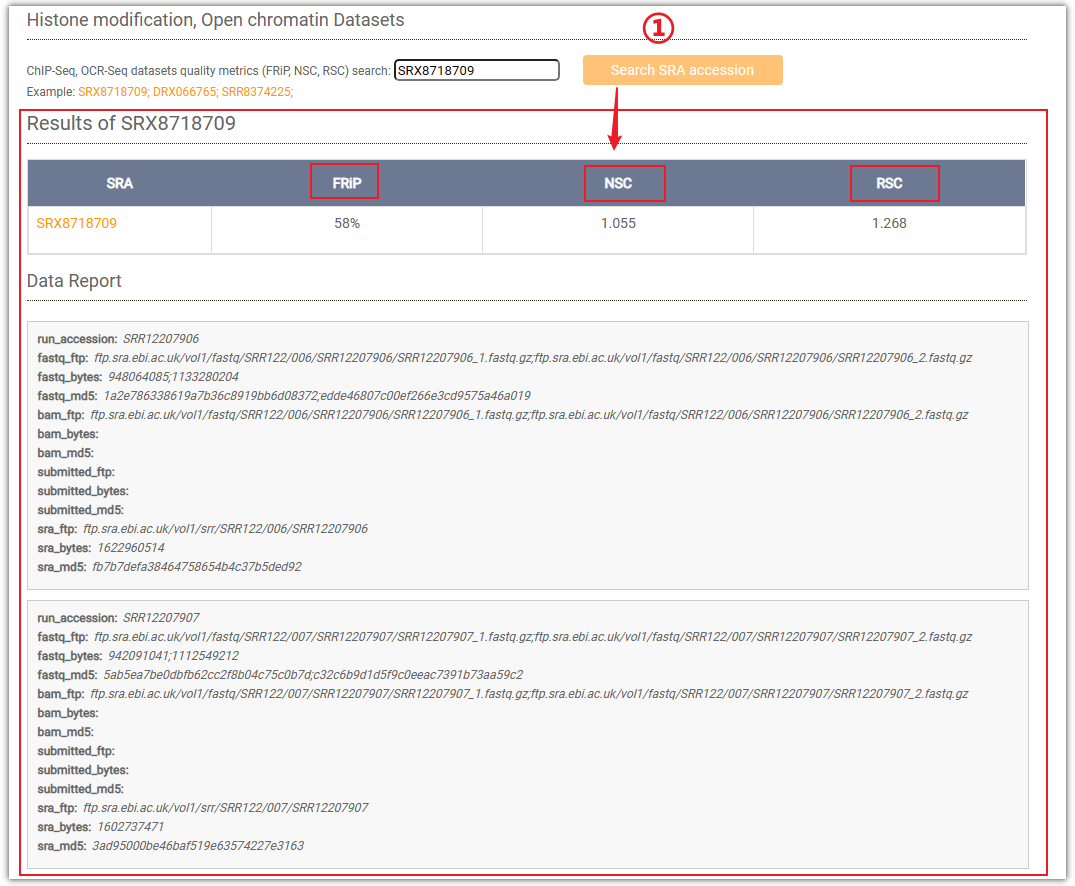
Taking "Histone modification" as an example, enter "SRX8718709" in the input box, then click ① to query. AraENCODE provides three metrics "FRiP, NSC, RSC" to evaluate the quality of the data.
AraENCODE provides bigwig and peak file for users downloading.

Here are some news about the construction of the AraENCODE database:
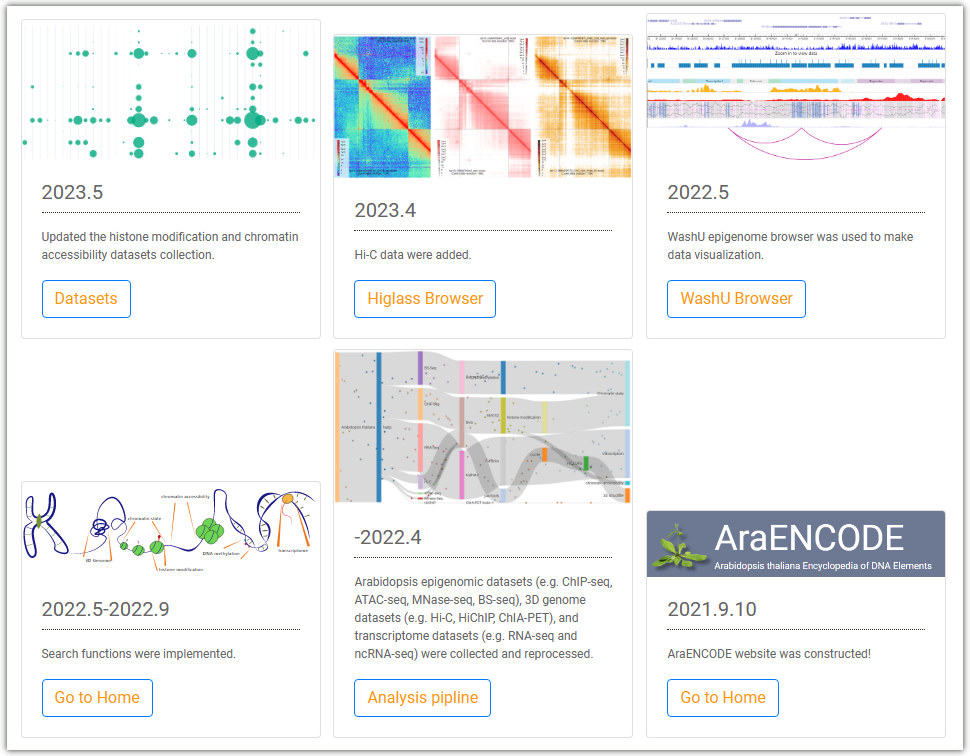
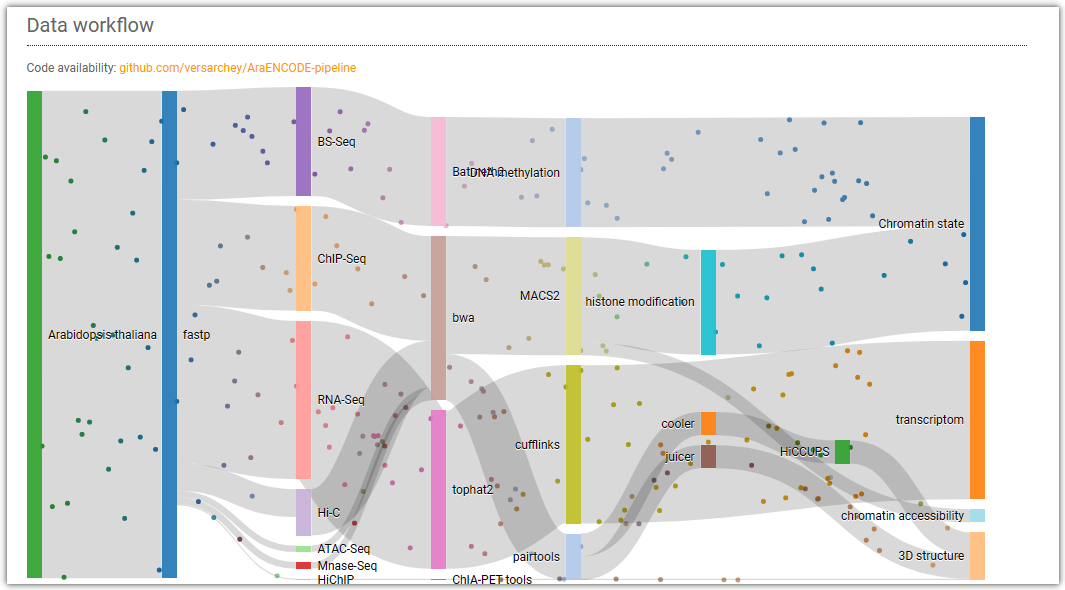
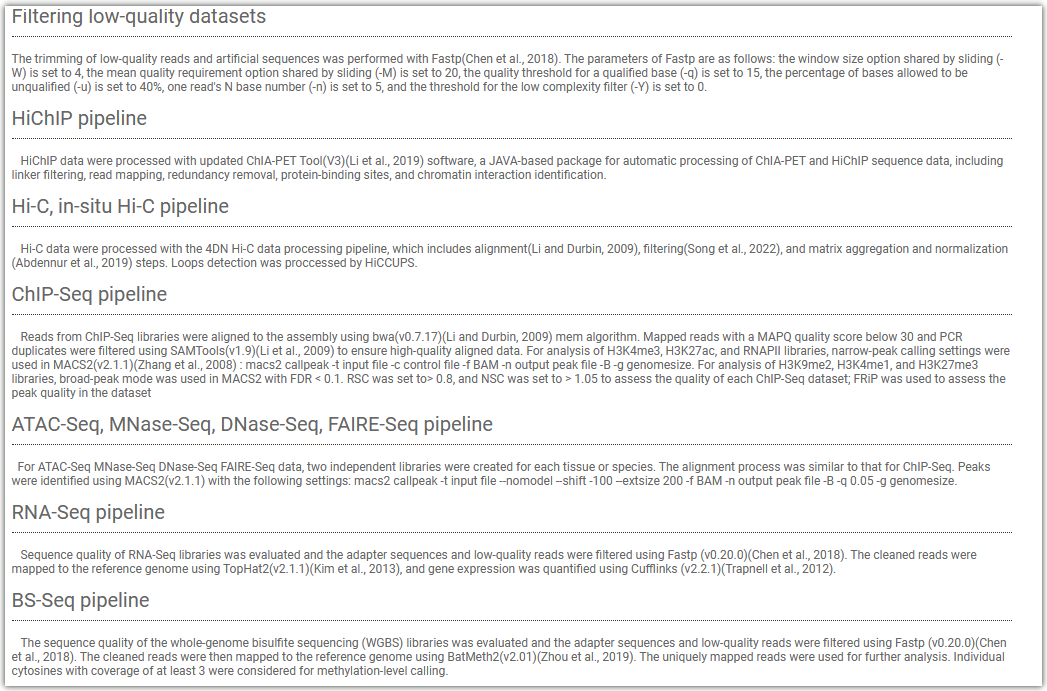
Here is the workflow for analyzing different libraries data in the AraENCODE database:
Here is a simple tutorial for using the AraENCODE database:
Welcome to contact us:
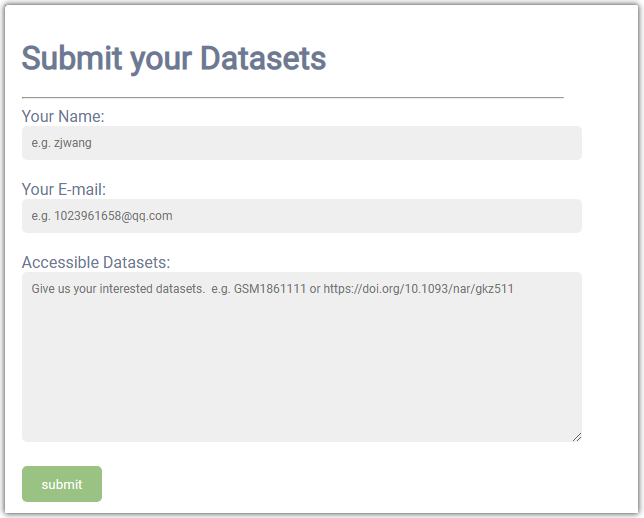
Welcome to send your interested datasets to our email, and we will check the mailbox irregularly:
AraENCODE Database © 2022, College of
Informatics, Huazhong Agricultural
University. All Rights Reserved
Any comments and suggestions, please contact us.