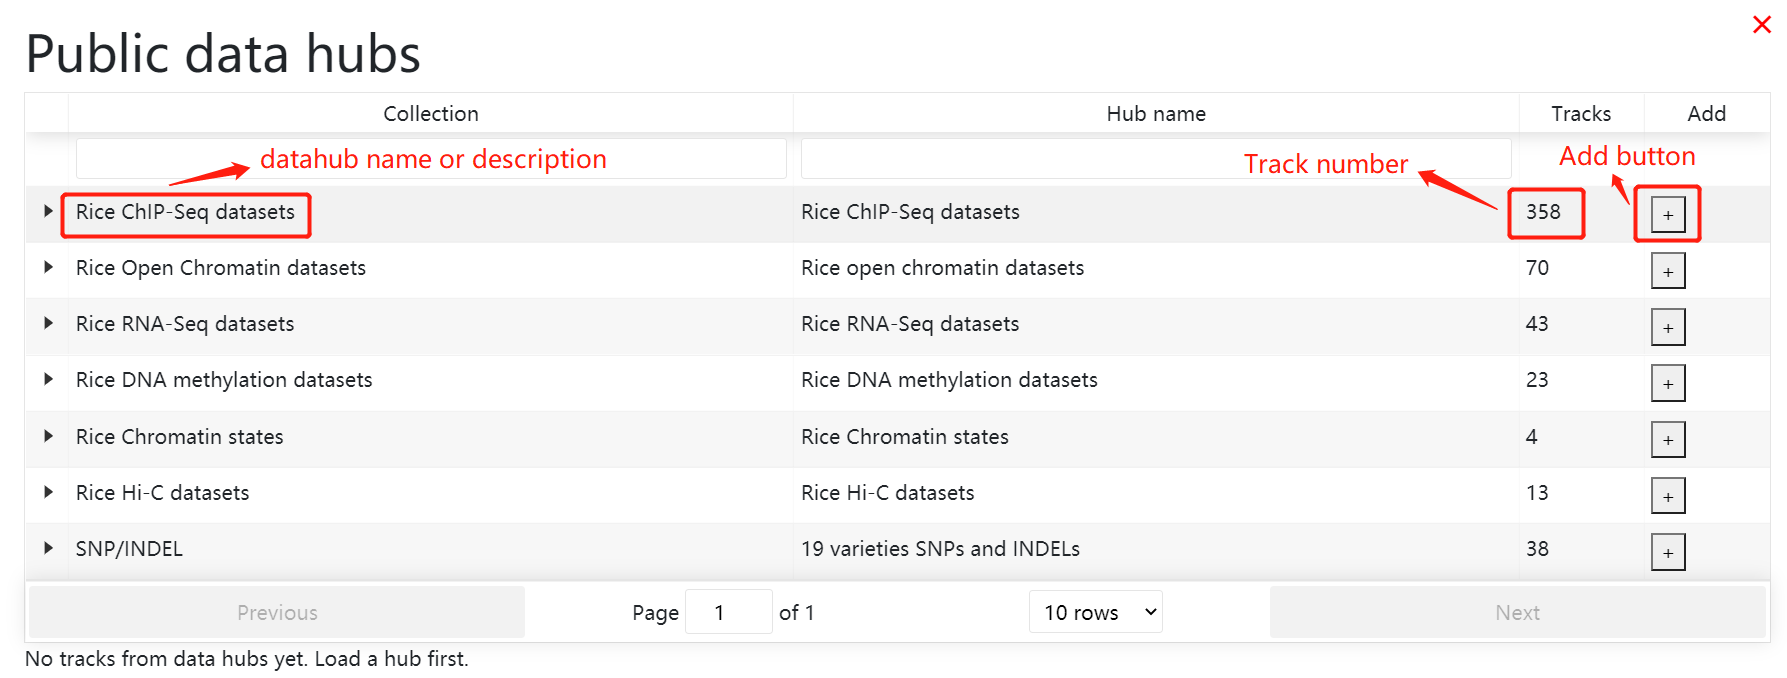
In RiceENCODE, we have integrated a large number of epigenetic data (ChIP-Seq,HiC,ChIA-PET,ATAC-Seq,Mnase-Seq,FAIRE-Seq,BS-Seq) and transctiptome data (RNA-Seq) from different species and tissues of plants from GEO, which provides an important browsing and searching module for the study of plant epigenomics.
PDF for using RiceENCODE
Download the tutorial file here tutorial PDF
Video for using RiceENCODE
3. Browse and search Histone modification in different samples.
4. Browse and search chromatin accessibility.
5. Browse and search interaction between gene to gene and gene to regions.
6. Browse and search gene expression.
7. Browse and search DNA methylation level.
8. Browse and search Chromatin state in different tissues and species.
9. Download all the bigwig and peaks file for different datasets.
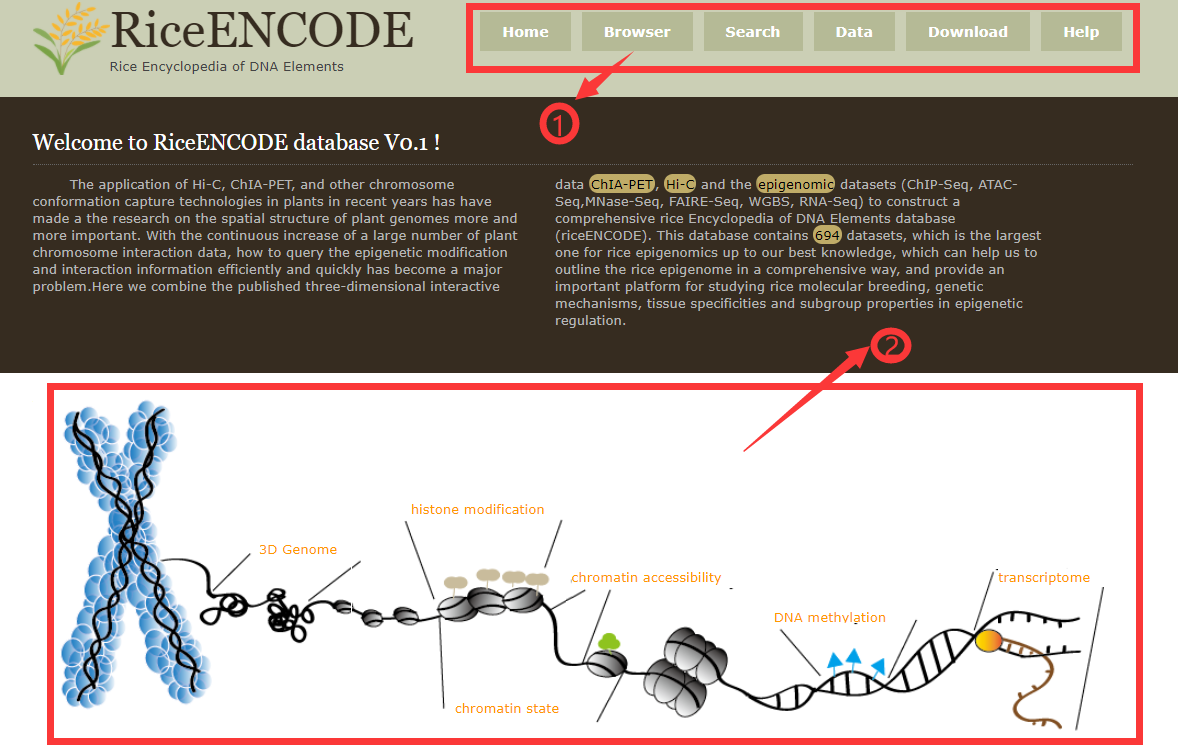
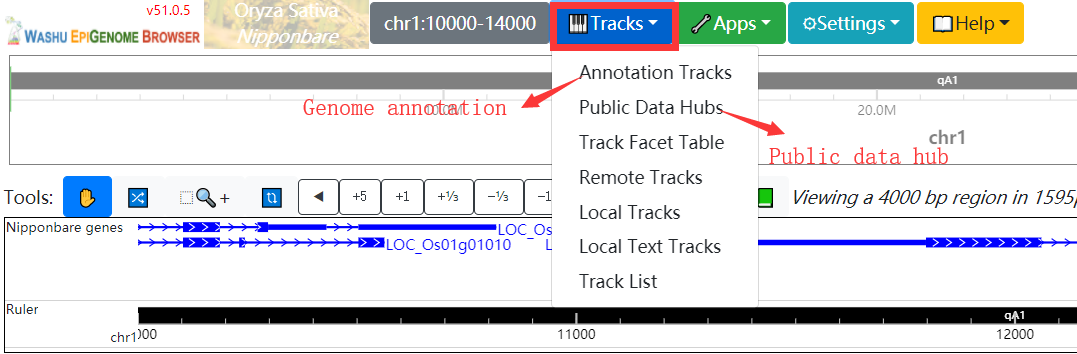
The top navigation menu gathers general functions of the database, including links to different search modules.
Part 2:Schematic diagram of the introduction to the RiceENCODE search module. Each orange part can jump to the page respectively.
1.1 Quick search.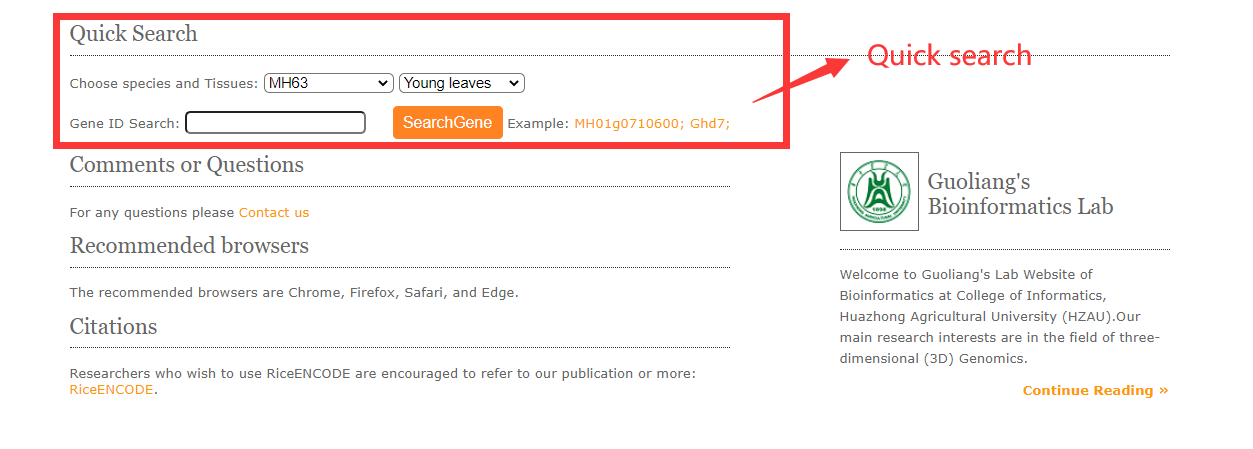
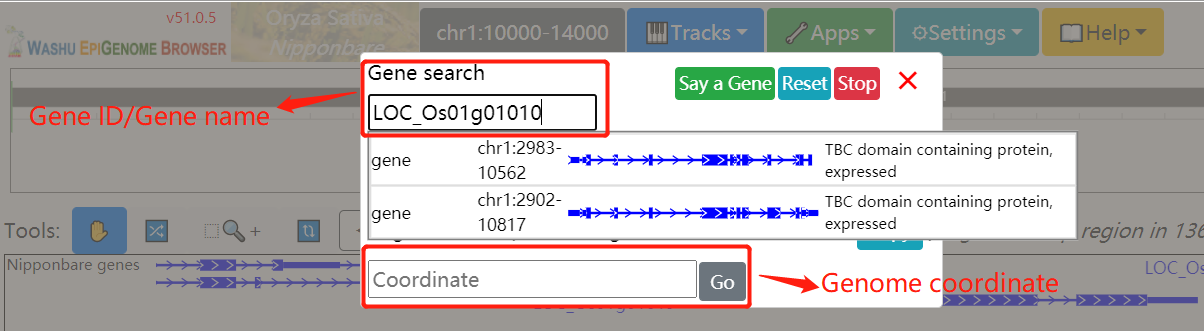
Quick search engine to help users query the histone modification, DNA interaction information, and tissue expression flexibly. This kind of global search can help users quickly locate the marker histone modification or DNA interaction, especially when users have no clear target histone modifications to search. Select target genome and tissues then submit the gene ID and click on the search button.
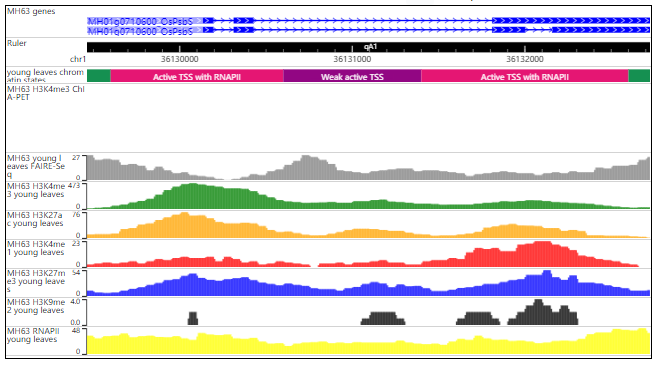
For example (OsPsbS) the genome browser in results like this:
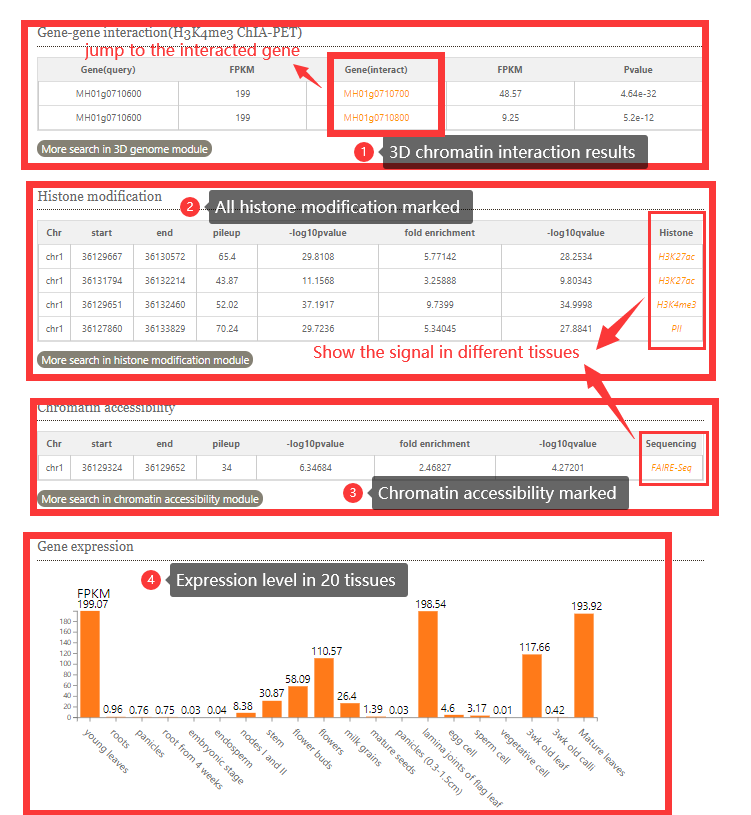
The resulted tabular layout looks like this:
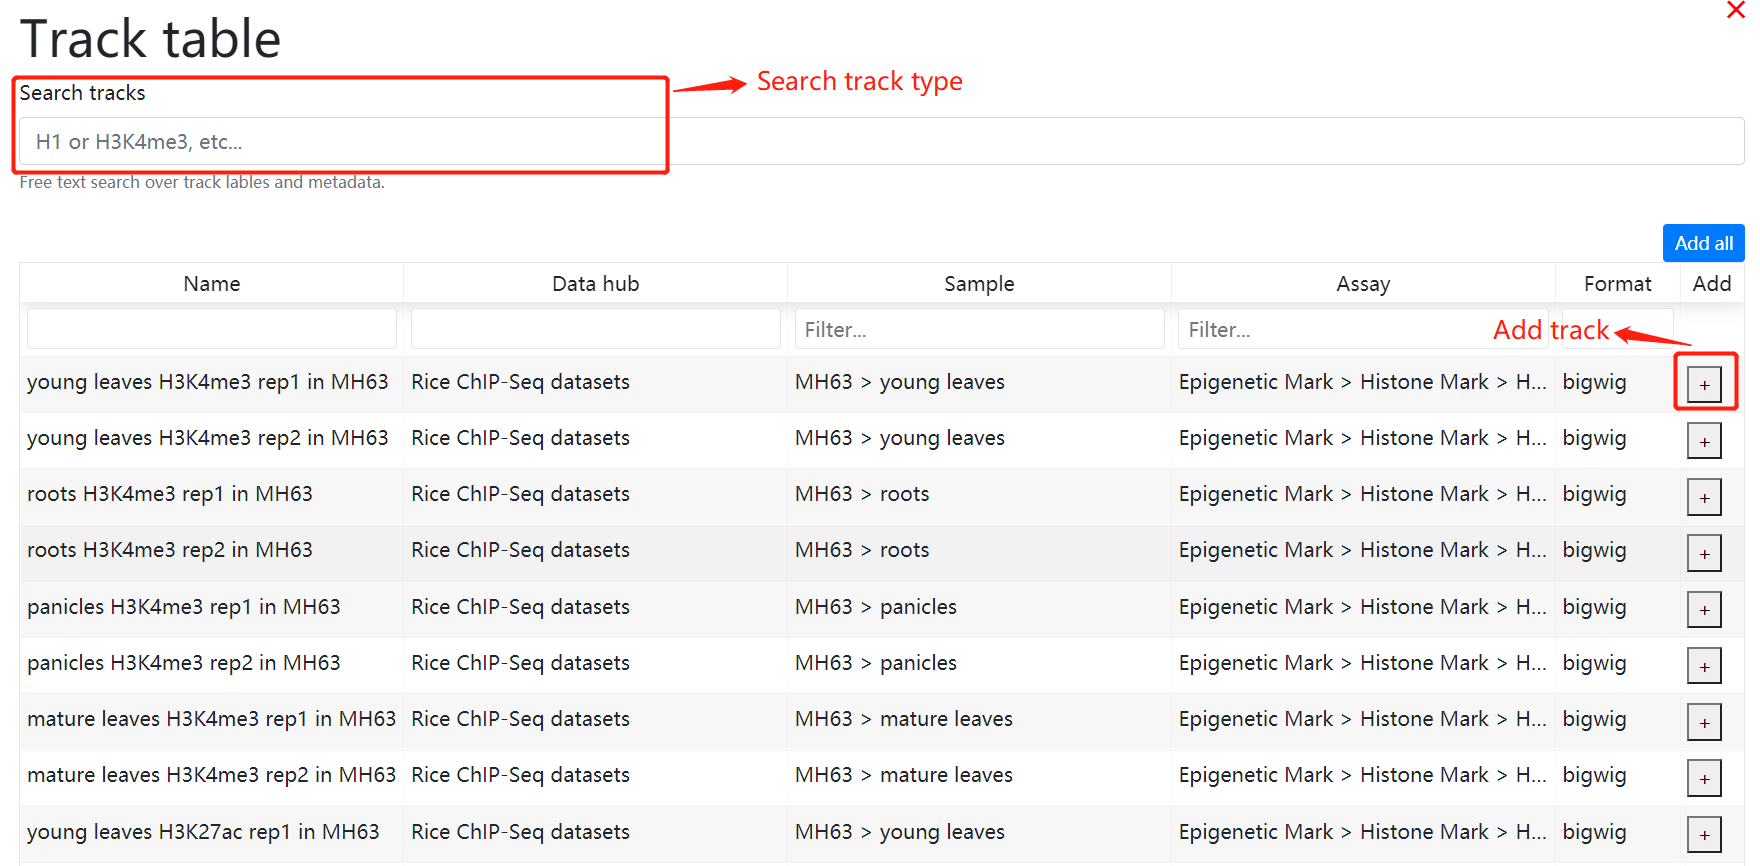
In Genome Browser module, RiceENCODE provides a WashU Epigenome Browser instance to better visualize large number of epigenetic datasets.More details about WashU Epigenome Browser can be found in its official documentation:
WashU Epigenome Browser Documentation
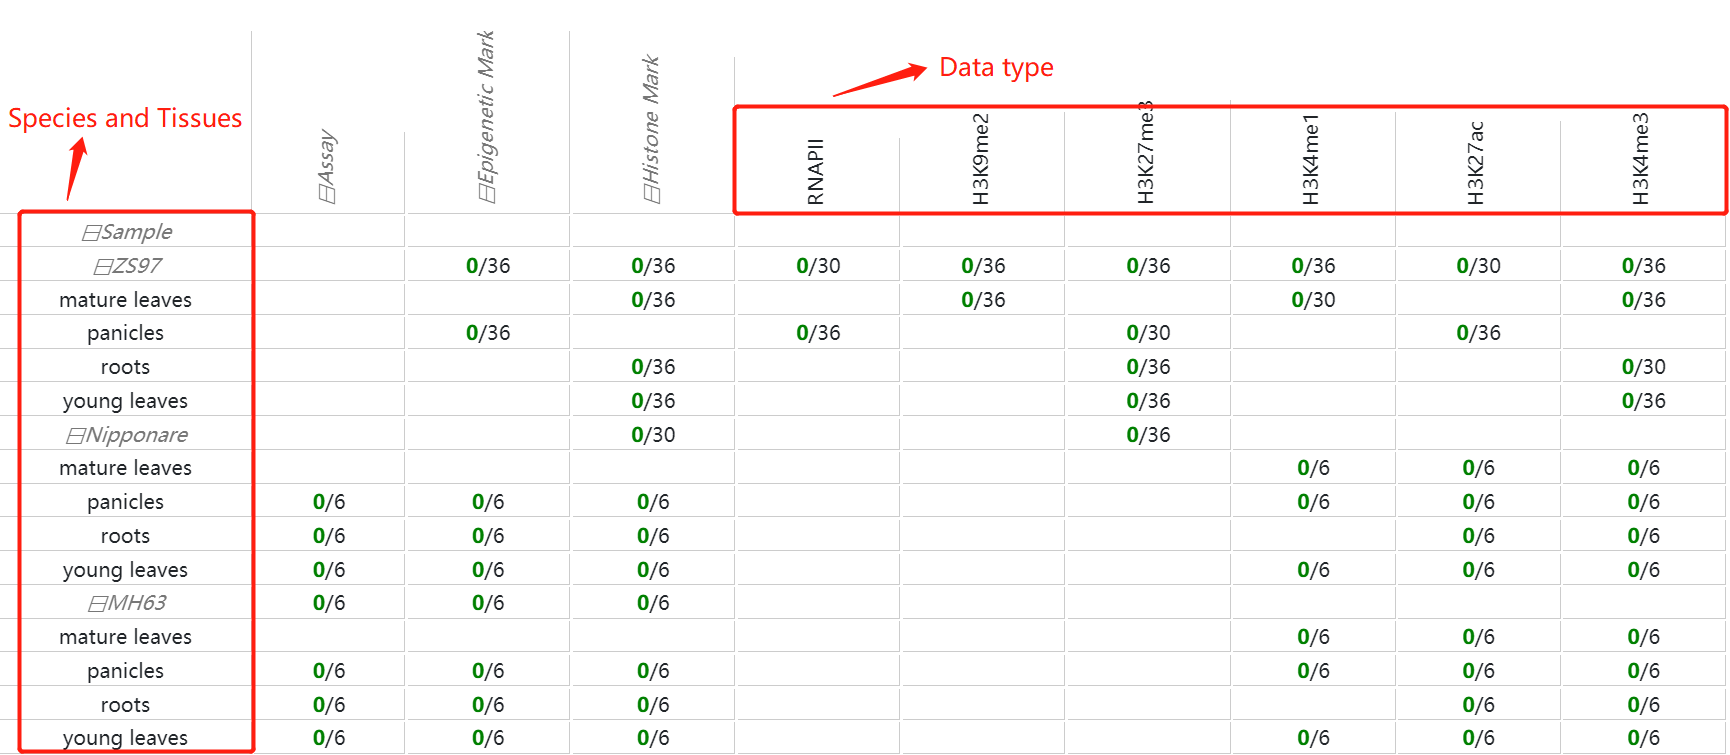
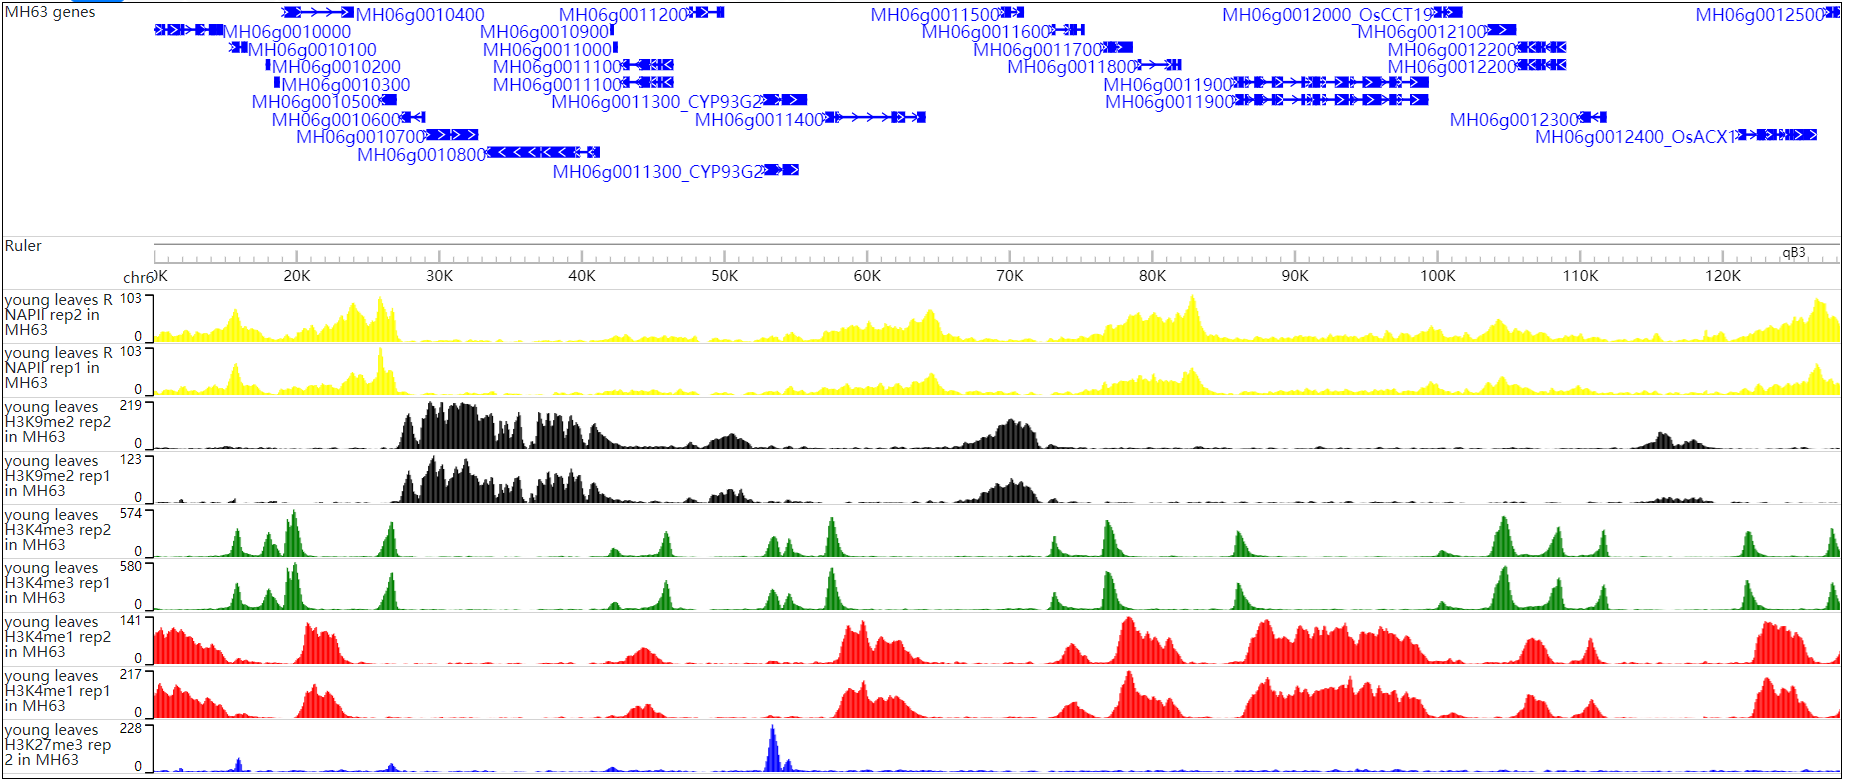
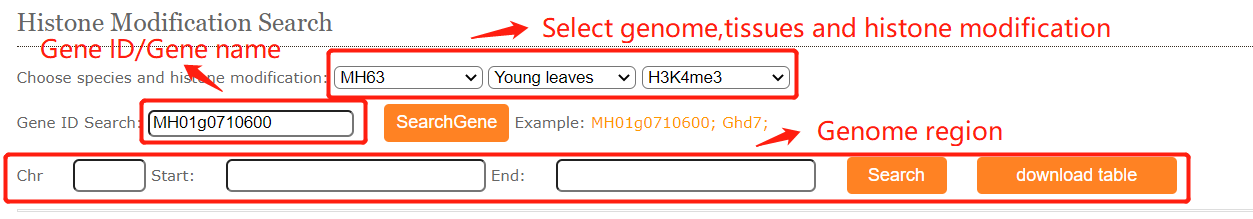
In histone modification module, users can easily search for histone modification signals in different tissues.
To get the histone modification signals information. you can either select a query genome region or a target gene after you selected target genome ,histone mark and tissues.And click on the Search button to get the results.
The histone modification viewer provides and tabular layouts for the resulted blocks.
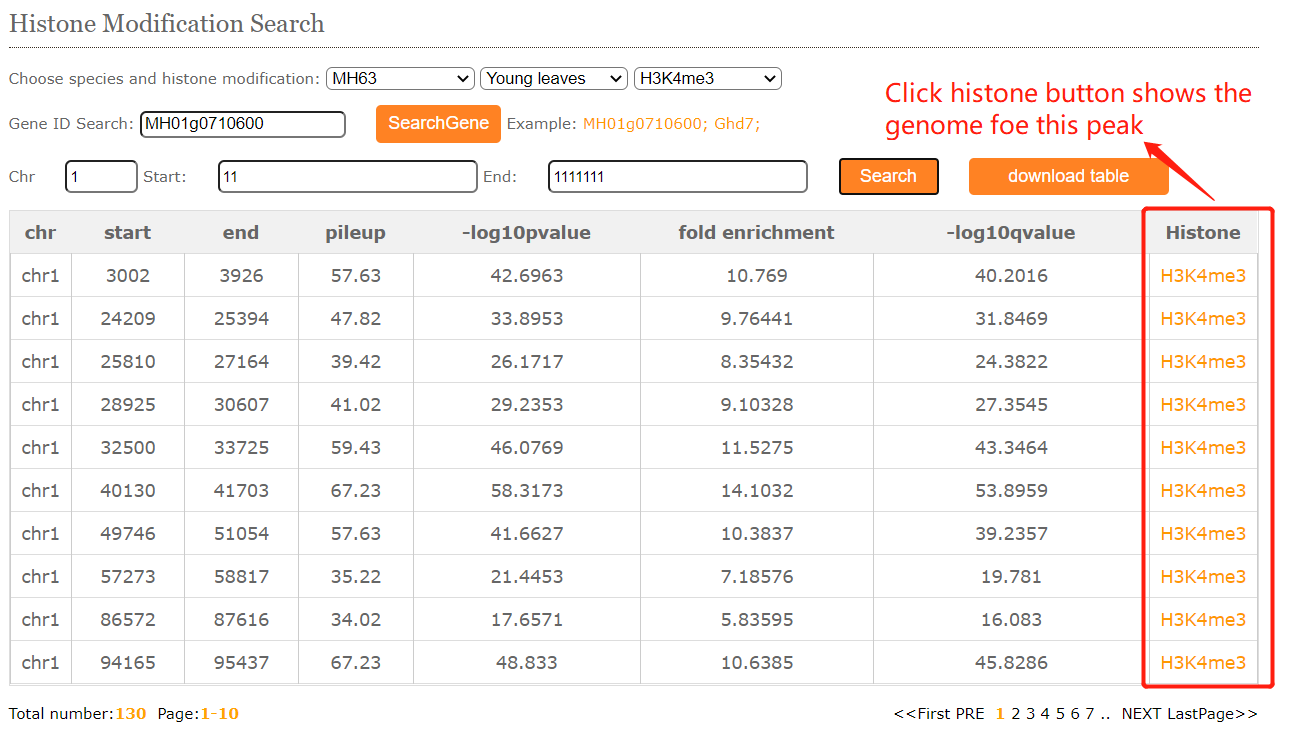
Corresponding to peak regions in different tissues

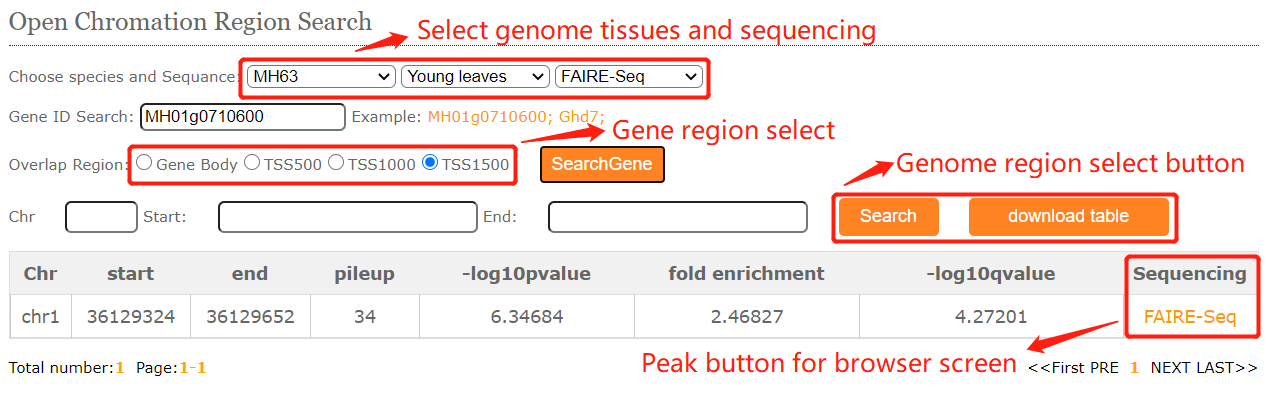
In chromatin accessibility module, users can easily search for chromatin accessibility signals (Dnase-Seq, ATAC-Seq,Mnase-Seq,FAIRE-Seq )in different tissues.
In 3D interaction search module, users can easily search for gene-gene interactions, gene-region interactions and region-region interactions in different genome ,tissues and sequencing.
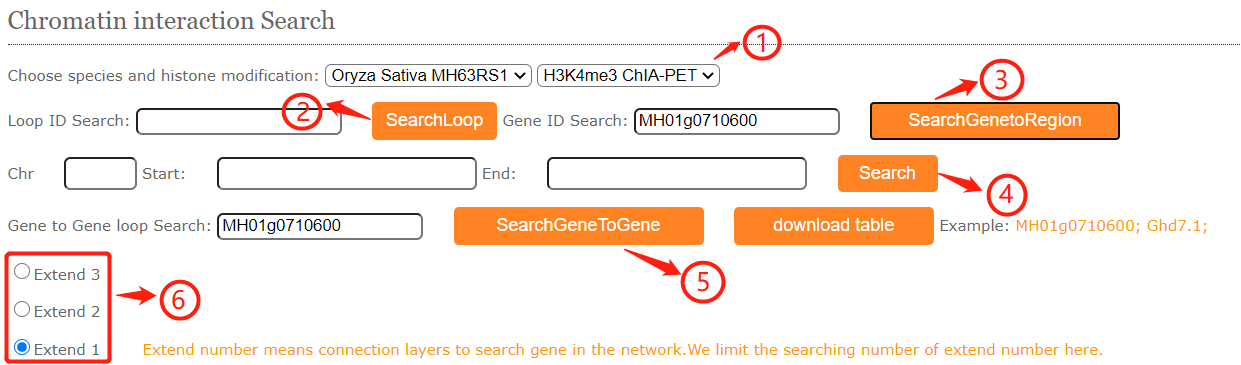
shows the selector for genome and sequencing.
Part 2:In the loop ID search module, fill in the blanks with an loop ID (MH63_H3K4me3_Loop1) then cilck the search button and resulted tabular layout looks like this:
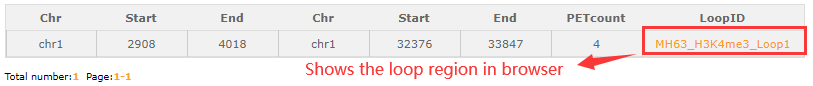
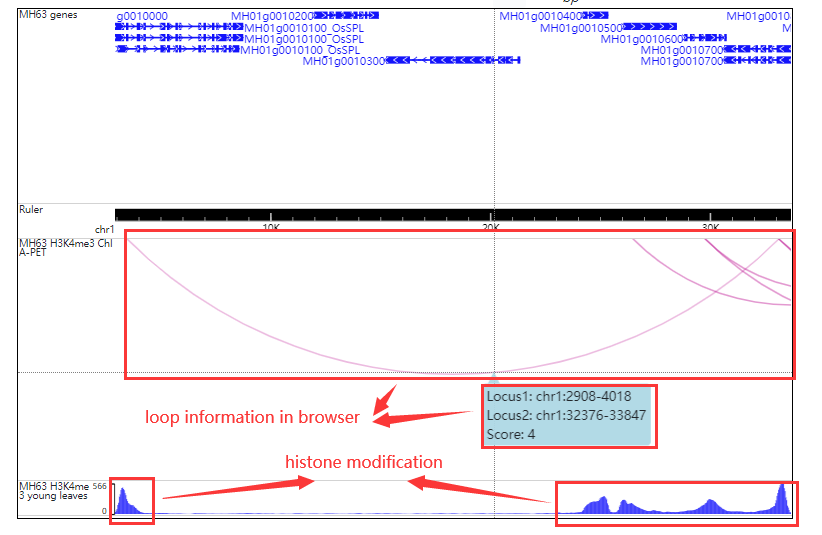
Click orange part the result look like this:
In the gene-region search module, users may have some interesting gene and want to know the interactive regions.Fill the gene ID (Ghd7.1) and the resulted tabular layout looks like this:
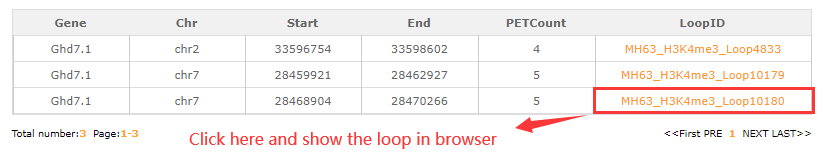
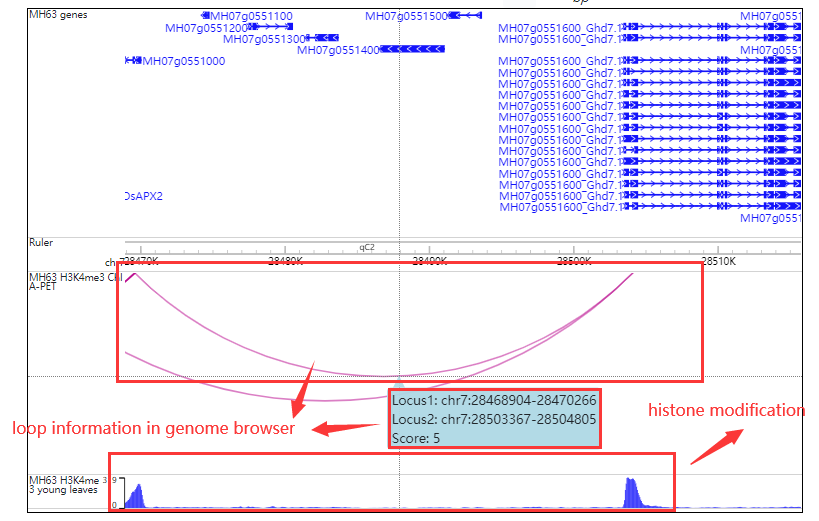
Click orange part the result look like this:
In the region-region search module, users may have some interesting region and want to know the interactive regions.Fill the chr:start-end and the resulted tabular layout looks like this:
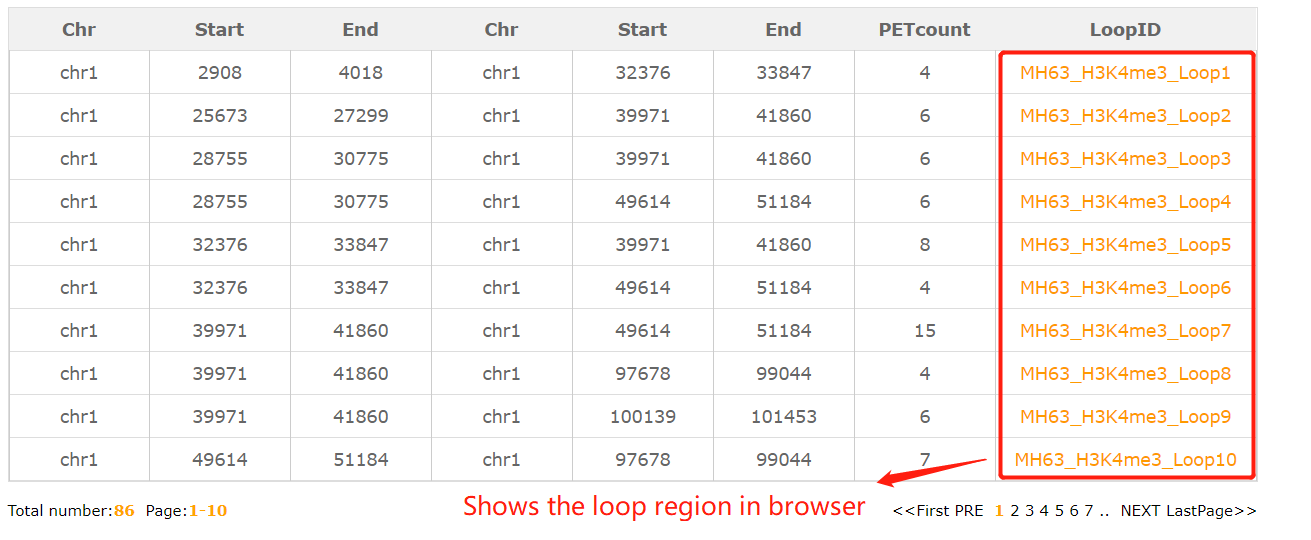
Click the loop number (MH63_H3K4me3_Loop1) the result look like this:
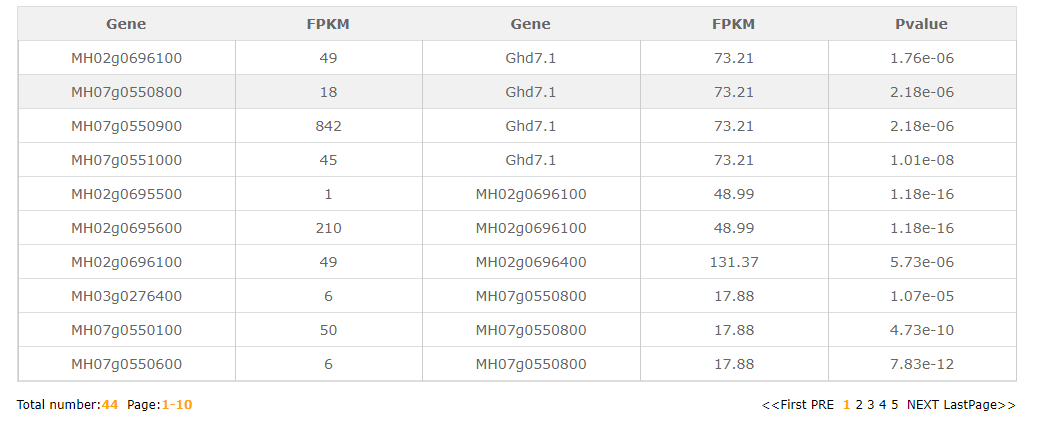
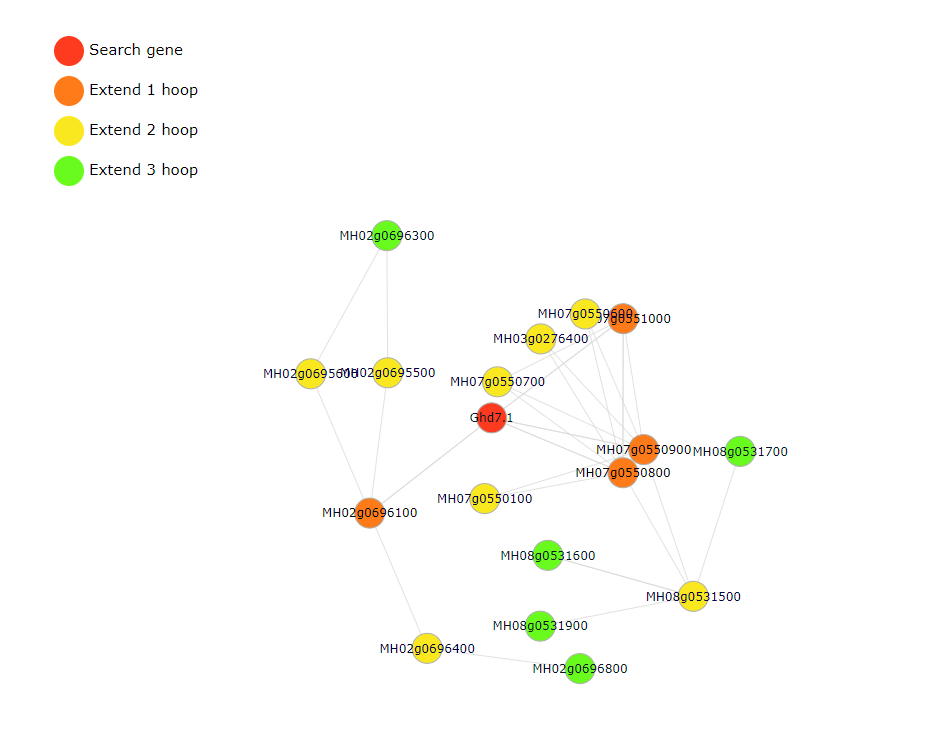
In the gene-gene search module, users may have some interesting gene and want to know the interactive gene.Fill the gene ID or gene name in part 5 and choose the extend degree in part 6(extend degree means the network connectivity). The resulted tabular and network layout looks like this:
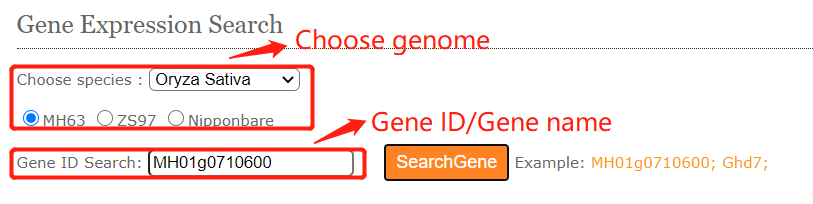
In gene expression search module, users can easily search for FPKM from different tissues transcriptome data(RNA-Seq) we collected.
To get the gene expression level information. you can either select a query genome and a target gene .And click on the Search button to get the results.
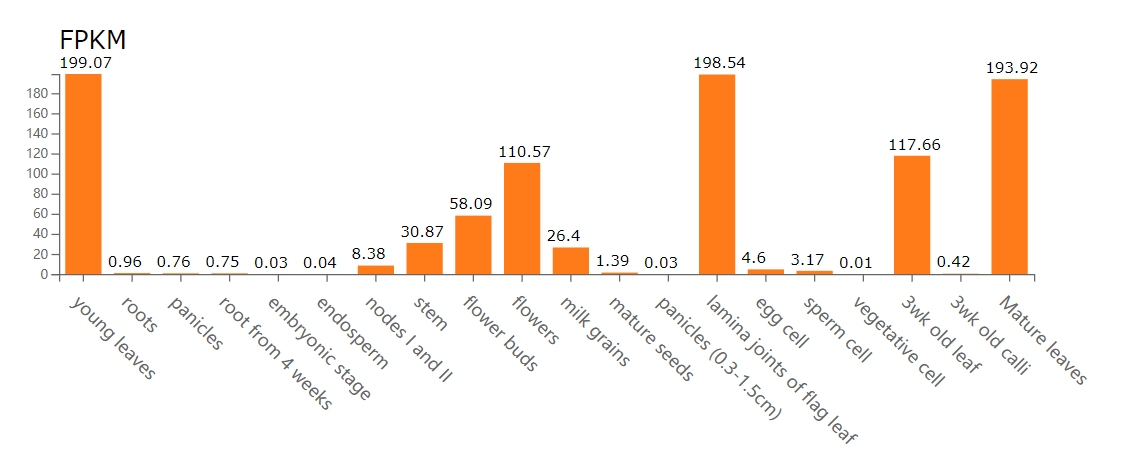
The gene expression viewer provides and bar plot for the resulted blocks.
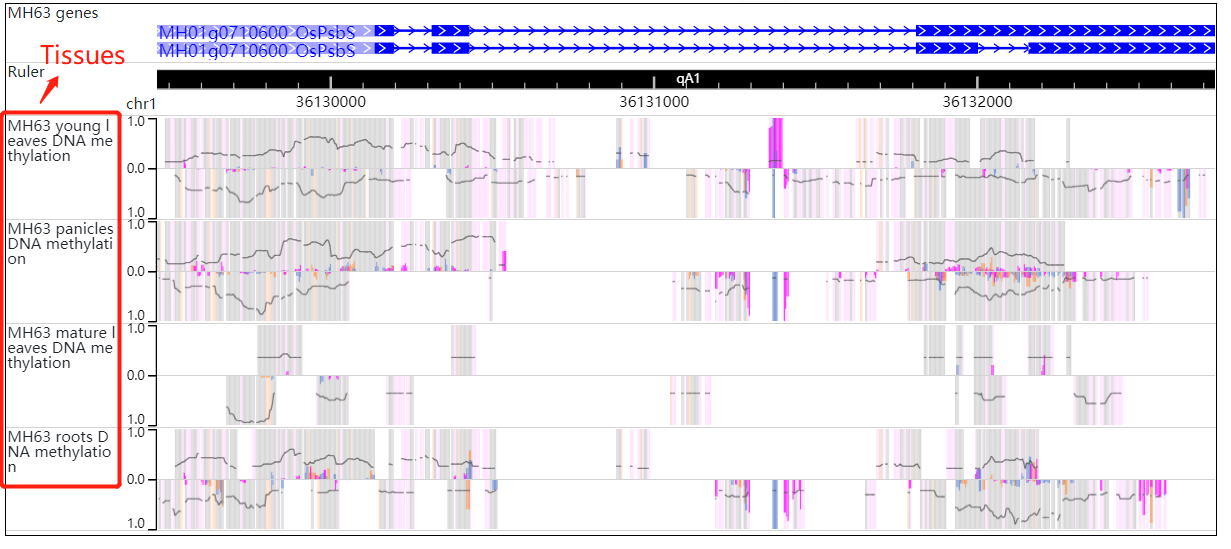
In DNA methylation search module, users can easily search DNA methylation level for genes ,regions and DMR between different tissues.
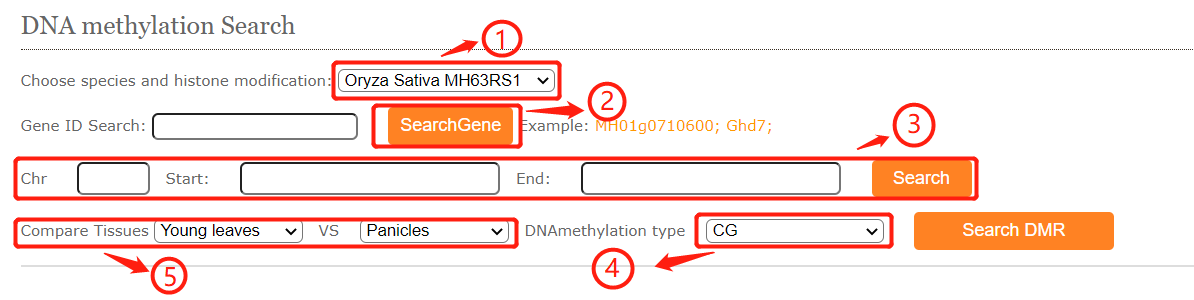
shows the selector for genome methylation type.
Part 2 and 3:In the gene ID search module, fill in the blanks with an gene ID (MH01g0710600/OsPsbS) , gene name or chr:start-end then cilck the search button and resulted tabular layout looks like this:
In the DMR search module, fill in the blanks with the chr:start-end then cilck the DMR search button and resulted tabular layout looks like this:
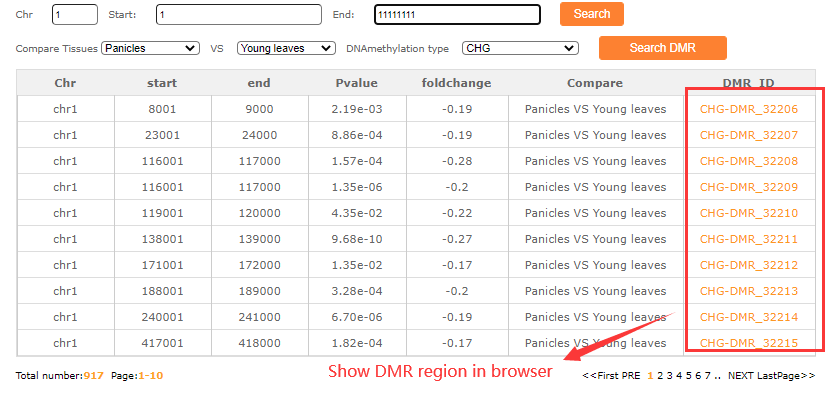
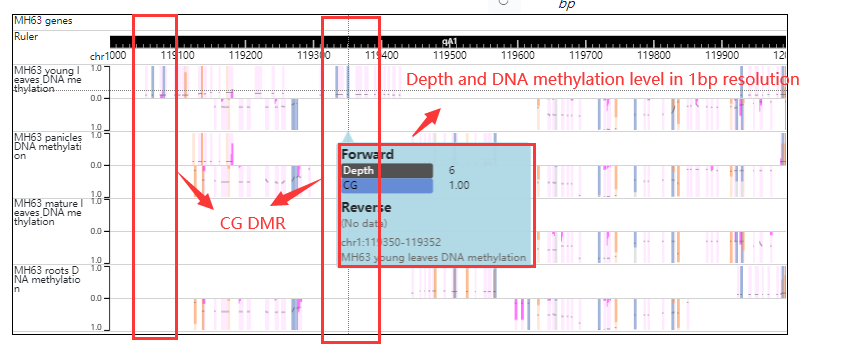
For example click the DMR number (CHG-DMR_32210) the result look like this:
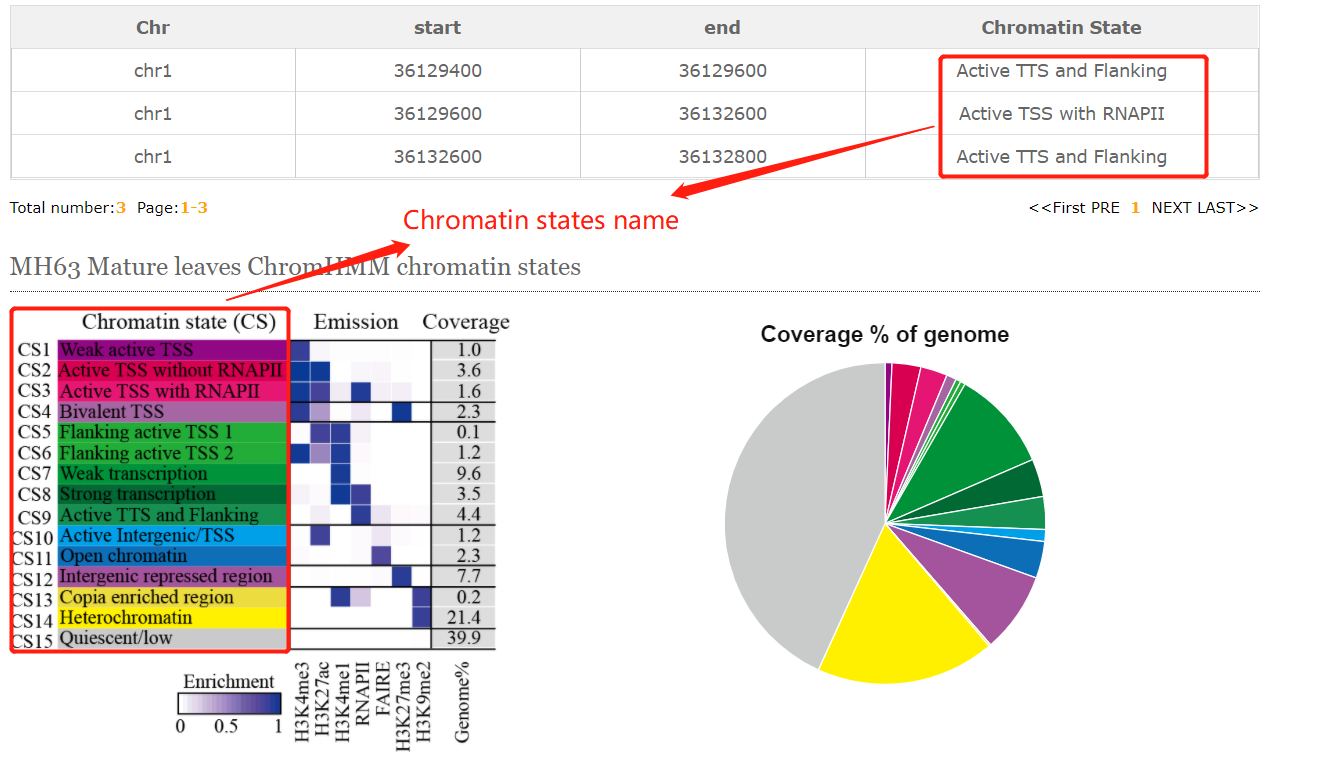
CENCODE provides chromatin states search module. Although users are only allowed to search limited tissues we collected, the easily online search module can help biologists better understand the epigenetic regulation of interested regions or genes.
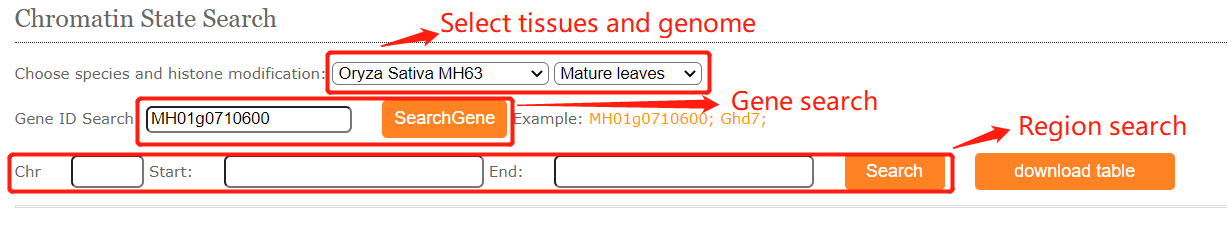
The resulted tabular layout looks like this:
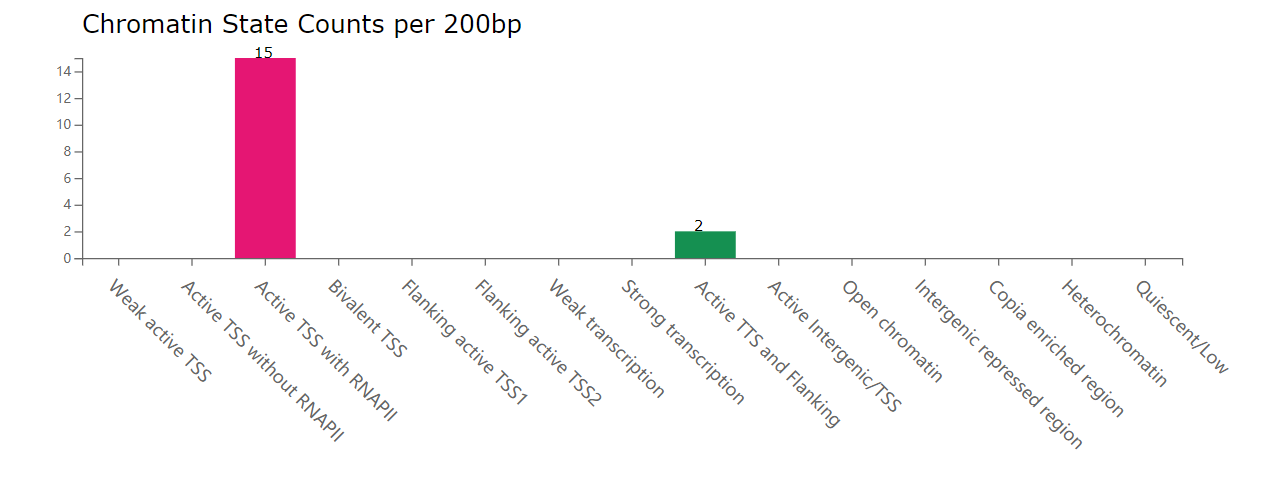
Bar plot for chromatin state counts:
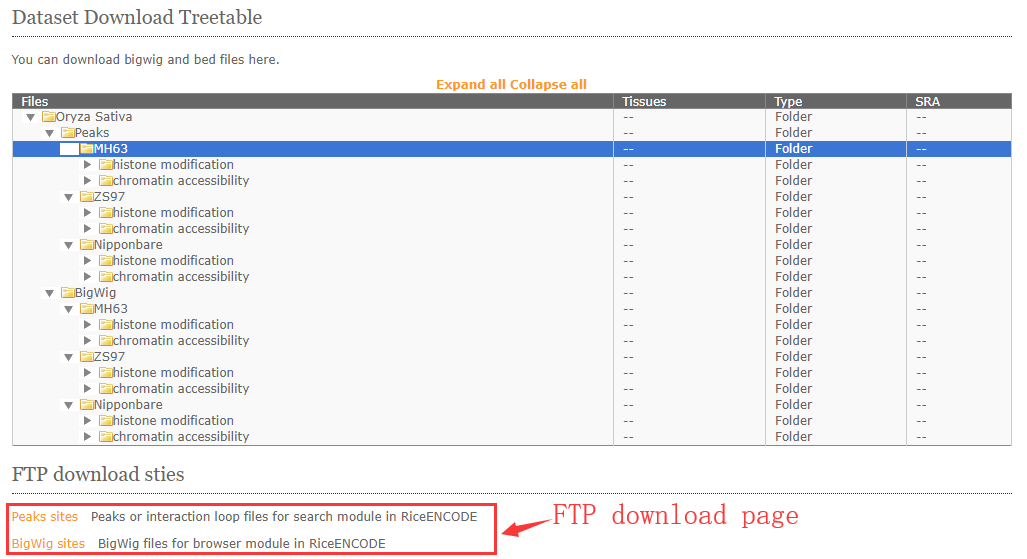
RiceENCODE provides bigwig and peak file for users downloading.
RiceENCODE Database © 2021, College of Informatics, Huazhong Agricultural University. All Rights Reserved
Any comments and suggestions, please contact us.